Story Highlights
- Northamptonshire had total property sales of £3.48 Billions in 2015.
- The total number of properties sold in 2015 in Northamptonshire was 15,300
- The total volume of sales at district level was maximum for Northampton at £949 millions
- The average sales price in Northamptonshire was £227 K, whereas median was £178 K
- The average sales price at district level was maximum for South Northamptonshire at £312 K
- The median sales price at district level was also maximum for South Northamptonshire at £270 K
- New Property sales in Northamptonshire contributed 16.1% and Not New Property contributed 83.9%
Northamptonshire is one of the counties of East Midlands. The districts of Northamptonshire are Northampton, South Northamptonshire, Kettering, Daventry, East Northamptonshire, Wellingborough, Corby.
Total Sales By Districts
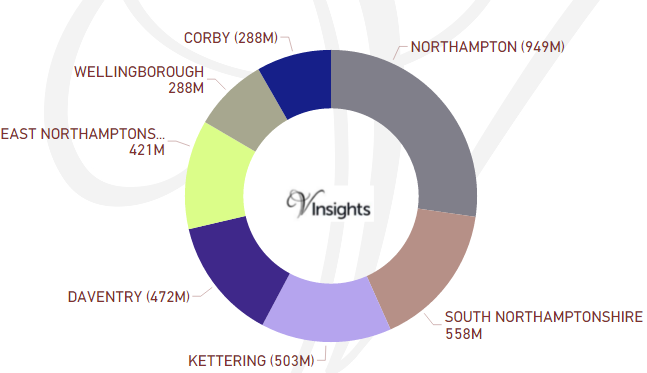
Northamptonshire had total property sales of £3.48 Billions which was 20.75% of the East Midland Property Market 2015.
The split across its districts is as follows:
- Northampton at £949 millions (27.28%)
- South Northamptonshire at £558 millions (16.04%)
- Kettering at £503 millions (14.46%)
- Daventry at £472 millions (13.57%)
- East Northamptonshire at £421 millions (12.09%)
- Wellingborough at £288 millions (8.28%)
- Corby at £288 millions (8.28%)
Total Sales By Property Type
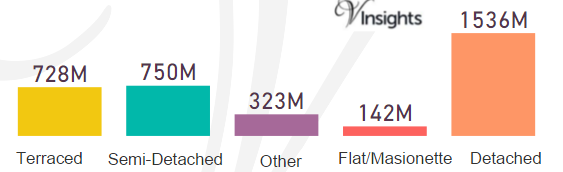
The split of £3.48 Billions across the different property types in Northamptonshire are :
- Detached at £1.54 billions (44.15%)
- Semi-Detached at £750 millions (21.56%)
- Terraced at £728 millions (20.93%)
- Flat/Maisonette at £142 millions (4.09%)
- Other at £323 millions (9.27%)
Total No Of Properties Sold By Property Type
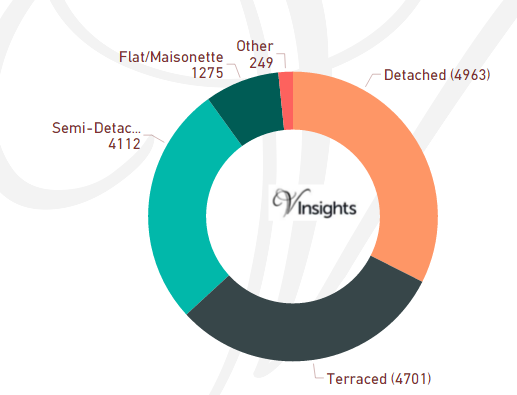
The total property sales of £3.48 Billions in 2015 was spread over 15,300 properties.
- Detached at 4963 (32.44%)
- Semi-Detached at 4112 (26.88%)
- Terraced properties at 4701 (30.73%)
- Flat/Maisonette at 1275 (8.33%)
- Others at 249 (1.63%)
Average & Median Sales Price
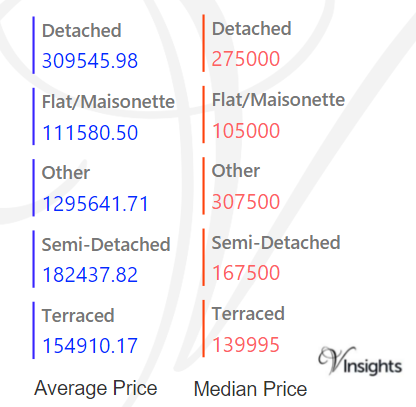
The average sales price in Northamptonshire was 227 K
For the different property types it was
- Detached at £310 K
- Semi-Detached at £183 K
- Terraced at £155 K
- Flat/Maisonette at £112 K
- Other it is at £1.3 millions
Similarly the median sales price in Northamptonshire was 178 K
For the different property types it was
- Detached at £275 K
- Semi-Detached at £168 K
- Terraced at £140 K
- Flat/Maisonette at £105 K
- Other it is at £308 K
Average & Median Sales Price By Districts
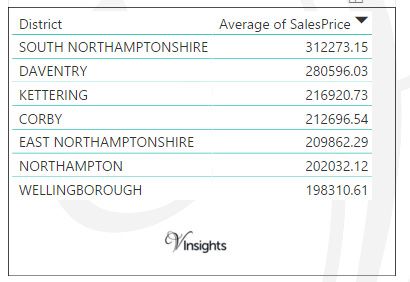
The average sales prices at district level in Northamptonshire for 2015 is as follows:
- South Northamptonshire at £312 K
- Daventry at £281 K
- Kettering at £217 K
- Corby at £213 K
- East Northamptonshire at £210 K
- Northampton at £202 K
- Wellingborough at £198 K
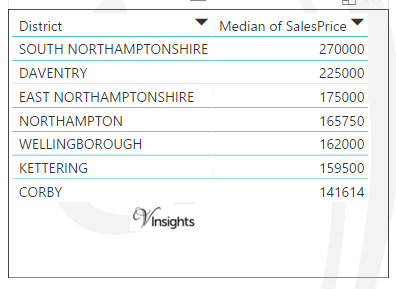
The median sales prices at district level in Northamptonshire for 2015 is as follows:
- South Northamptonshire at £270 K
- Daventry at £225 K
- East Northamptonshire at £175 K
- Northampton at £166 K
- Wellingborough at £162 K
- Kettering at £160 K
- Corby at £142 K
New Vs Not New Property Statistics
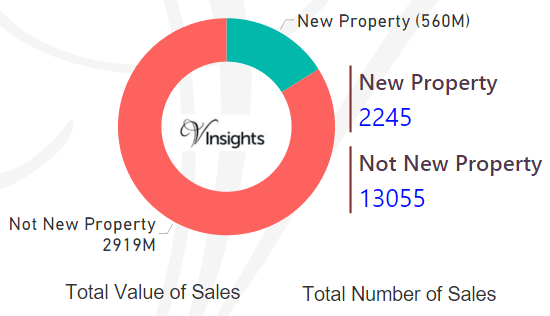
By Sales Values the split is as follows:
- New Properties contributed £560 millions (16.1%)
- Not New Property contributed £2.92 billions (83.9%)
By Total Number the split is as follows:
- New properties sold were 2245 (14.67%)
- Not new property sold were 13,055 (85.33%)
All Northamptonshire Posts

9480b2ac-b88a-4505-bdfa-02ab3e14b11b|0|.0|27604f05-86ad-47ef-9e05-950bb762570c