Derby Property Market 2016 at Postcode Level with School Details


Postcode Coverage Area School Local Authority Area
DE1 Derbycity centre Details Derby
DE3 Derby(Mickleover) Details Derby,South Derbyshire
DE6 Ashbourne,Hulland Ward,Weston Underwood Details Derbyshire Dales, Amber Valley, South Derbyshire, Derby,East Staffordshire
DE21 Derby(Chaddesden,Oakwood,Spondon),Breadsall,Horsle y,Little Eaton Details Derby, Erewash, Amber Valley
DE22 Derby(Allestree,Darley Abbey,Mackworth (estate)),K edleston,Mackworth (village),Quarndon Details Derby, Amber Valley
DE23 Derby(Heatherton Village,Littleover,Normanton,Pear Tree,Sunny Hill) Details Derby, South Derbyshire
DE24 Derby(Allenton,Alvaston,Boulton,Osmaston,Shelton L ock,Sinfin,Wilmorton),Stenson Fields Details Derby, South Derbyshire
DE73 Derby(Chellaston),Barrow upon Trent,Ingleby,Melbou rne,Stanton by Bridge,Swarkestone,Ticknall Details Derby, South Derbyshire


All Posts on Derbyshire


St Albans Property Market 2016 at Postcode Level with School Details


Postcode Coverage Area School Local Authority Area
AL1 St Albans Details St Albans
AL2 St Albans,Bricket Wood,Colney Street,Frogmore,Lond on Colney,Napsbury,Park Street,Potters Crouch,Chis well Green Details St Albans,Hertsmere
AL3 St Albans,Childwickbury,Flamstead,Gorhambury,Marky ate,New Greens,Porters Wood,Redbourn,Sandridge Details St Albans,Dacorum
AL4 St Albans, Blackmore End,Colney Heath, London Coln ey,Jersey Farm,Marshalswick,Oaklands, Sandridge, S mallford,Tyttenhanger,Wheathampstead Details St Albans, Hertsmere,North Hertfordshire
AL5 Harpenden,Kinsbourne Green Details St Albans
WD5 Abbots Langley,Bedmond Details Three Rivers, St Albans
WD7 Radlett,Shenley Details Hertsmere, St Albans
WD25 Garston,Leavesden,Aldenham,Letchmore Heath Details Watford, Hertsmere, Three Rivers, St Albans


All Hertfordshire Posts

East Midlands Property Market 2016

Story Highlights

  • East Midlands in 2016 had total property sales of £18 billions.
  • The total number of properties sold in East Midlands in 2016 was 86,999
  • Across its counties total sales value was maximum in Leicestershire at £3.98 billions.
  • The average property price was £207 K and the median was £165 K
  • The average sales price at county level is maximum for Rutland at £298 K 
  • New properties contributed 11.02% by value and not new properties contributed 88.98%


East Midlands is one of the 9 principal areas of England. It consists of Derbyshire, Nottinghamshire, Lincolnshire, Leicestershire, Rutland, Northamptonshire


Total Sales By County

East Midlands - Total Sales By County

East Midlands in 2016 had total property sales of £18 billions. It is 6.05% of England and Wales Property Market 2016.

The split of £18 billions across its counties was:

Year on Year Comparison : Compared to East Midlands Property Market 2015 in 2016

  • All counties had growth in total sales except Rutland
  • Rutland had a decline of 4.5% over 2015


Total Value of Sales By Property Types
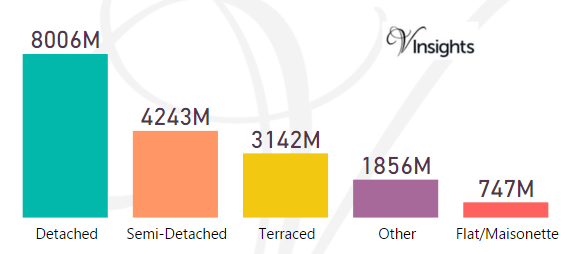
East Midlands - Total Value of Sales By Property Types

The split of £18 billions across the different property types are:

  • Detached at £8 billions (44.49%)
  • Semi-Detached at £4.24 billions (23.58%)
  • Terraced at £3.14 billions (17.46%) 
  • Other at £1.86 billions (10.32%)  
  • Flat/Maisonette at £747 millions (4.15%)

Year on Year Comparison : Compared to East Midlands Property Market 2015 in 2016

  • All property types have shown growth in total property sales value


Month-wise Break-up of Total Sales
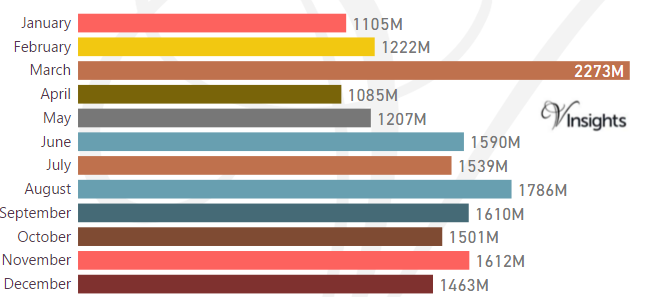
East Midlands - Month-wise Break-up of Total Sales

Stamp Duty Hike Impact

  1. March had property sale spike of £2.27 billions compared to £1.2 billions in Feb
  2. The impetus for it was to avoid the extra 3% in Stamp Duty Tax applicable on buying an additional home, being applicable from April 1 2016

Brexit Impact

  1. Brexit took place on 23rd June 2016.
  2. As can be observed from the month-wise break-up there does not seem to have been dip in property sales in the immediate aftermath of Brexit 
  3. Year on year (compared to 2015)  the growth was 5.88%
  4. So Brexit did not seem to negatively impact East Midlands Property Market 2016.


Total Number of Sales By Property Types
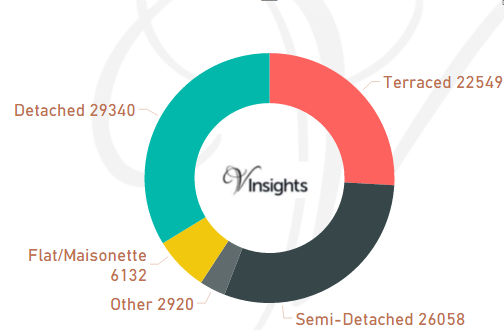
East Midlands - Total Number of Sales By Property Types

The total number of properties sold in East Midlands in 2016 was 86,999.

The split is :

  • Detached at 29,340 (33.72%)
  • Semi-Detached at 26,058 (29.95%)
  • Terraced at 22,549 (25.92%) 
  • Flat/Maisonette at 6,132 (7.05%) 
  • Other at 2,920 (3.36%) 

Year on Year Comparison : Compared to East Midlands Property Market 2015 in 2016

  • All the property types sales have shown growth except Detached, Terraced
  • Other has shown significant growth of 114%


Average & Median Sales Price 
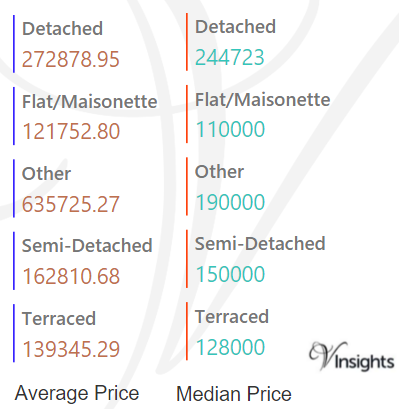
East Midlands - Average & Median Sales Price

The average sales price in East Midlands was 207 K.

For the different property types it was

  • Detached at £273 K
  • Semi-Detached at £163 K
  • Terraced at £139 K
  • Flat/Maisonette at £122 K
  • Other it is at £636 K

Similarly the median sales price in East Midlands was 165 K

For the different property types it was

  • Detached at £245 K
  • Semi-Detached at £150 K
  • Terraced at £128 K
  • Flat/Maisonette at £110 K
  • Other it is at £190 K

Year on Year Comparison : Compared to East Midlands Property Market 2015 in 2016

  • All property types have had increase in average and median sales prices except Other


Average & Median Sales Price By County
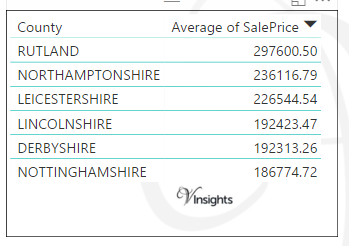
East Midlands - Average Sales Price By County

The average of sales price in East Midland at county level in 2016 is :
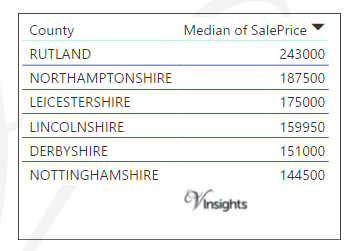
East Midlands - Median Sales Price By County

The median of sales price in East Midland at county level in 2016 is :

Year on Year Comparison : Compared to East Midlands Property Market 2015 in 2016

  • The average and median price across all counties have gone up.


New Vs Not New Property Statistics
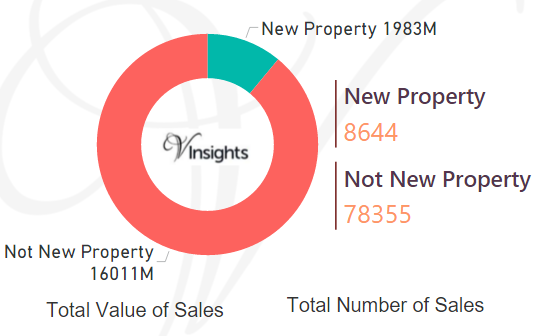
East Midlands - New Vs Not New Property Statistics

By Sales Value

  • Sales value contributed by New Property was £1.98 billions (11.02%)
  • where as Not New Property contributed £16 billions (88.98%)

By Number Of Sales

  • New properties sold were 8,644  (9.94%)
  • Not new property sold were 78,355 (90.06%)

 Year on Year Comparison : Compared to East Midlands Property Market 2015 in 2016

  • New property market share in property market has gone down in 2016 over 2015

All England Posts


Nottinghamshire Property Market 2015

Story Highlights

  • Nottinghamshire had total property sales of £3.36 Billions in 2015.
  • The total number of properties sold in 2015 in Nottinghamshire was 18,641
  • The total volume of sales at district level was maximum for City of Nottingham at £801 millions
  • The average sales price in Nottinghamshire was £180 K, whereas median was £136 K
  • The average sales price at district level was maximum for Rushcliffe at £271 K
  • The median sales price at district level was also maximum for Rushcliffe at £235 K
  • New Property sales in Nottinghamshire contributed 8.71% and Not New Property contributed 91.29%


Nottinghamshire is one of the counties of East Midlands. Nottinghamshire districts are City of Nottingham, Rushcliffe, Newark and Sherwood, Gedling, Broxtowe, Ashfield, Bassetlaw, Mansfield.


Total Sales By Districts

 Nottinghamshire - Total Sales By Districts

Nottinghamshire had total property sales of £3.36 Billions which was 20.05% of the East Midland Property Market 2015.

  • City of Nottingham at £801 millions (23.81%)
  • Rushcliffe at £574 millions (17.07%)
  • Newark and Sherwood at £406 millions (12.08%)
  • Gedling at £387 millions (11.53%)
  • Broxtowe at £326 millions (9.71%)
  • Ashfield at £306 millions (9.09%)
  • Bassetlaw at £299 millions (8.89%)
  • Mansfield at £263 millions (7.82%)


Total Sales By Property Type

Nottinghamshire - Total Sales By Property Type

 The split of £3.36 Billions across the different property types in Nottinghamshire are :

  • Detached at £1.49 billions (44.36%)
  • Semi-Detached at £835 millions (24.85%)   
  • Terraced at £550 millions (16.35%)
  • Flat/Maisonette at £159 millions (4.74%) 
  • Other at £326 millions (9.71%)


Total No Of Properties Sold By Property Type

Nottinghamshire - Total No Of Properties Sold By Property Type

The total property sales of £3.36 Billions in 2015 was spread over 18,641 properties.

  • Detached at 6036 (32.38%)
  • Semi-Detached at 6008 (32.23%)
  • Terraced properties at 4913 (26.36%)
  • Flat/Maisonette at 1395 (7.48%)
  • Others at 289 (1.55%)


Average & Median Sales Price

Nottinghamshire - Average & Median Sales Price


The average sales price in Nottinghamshire was £180 K. For the different property types it was:

  • Detached at £247 K
  • Semi-Detached at £139 K
  • Terraced at £112 K
  • Flat/Maisonette at £114 K
  • Other at £1.13 million


Similarly median sales price in Nottinghamshire was £136 K. For different property types it was:

  • Detached at £215 K
  • Semi-Detached at £125 K
  • Terraced at £100 K
  • Flat/Maisonette at £100 K
  • Other at £298 K


Average & Median Sales Price By Districts

Nottinghamshire - Average Sales Price By Districts

 The average sales prices at district level in Nottinghamshire for 2015 is as follows:

  • Rushcliffe at £271 K
  • Newark and Sherwood at £190 K
  • City of Nottingham at £184 K
  • Gedling at £177 K
  • Broxtowe at £172 K
  • Bassetlaw at £157 K
  • Ashfield at £142 K
  • Mansfield at £141 K


Nottinghamshire - Median Sales Price By Districts

 The median sales prices at district level in Nottinghamshire for 2015 is as follows:

  • Rushcliffe at £235 K
  • Newark and Sherwood at £152 K
  • Gedling at £148 K
  • Broxtowe at £148 K
  • Bassetlaw at £132 K
  • Ashfield at £121 K
  • Mansfield at £120 K
  • City of Nottingham at £ 113 K


New Vs Not New Property Statistics

Nottinghamshire - New Vs Not New Property Statistics


By Sales Values the split is as follows:

  • New Properties contributed £293 millions (8.71%) 
  • Not New Property contributed £3.07 billions (91.29%)


By Total Number the split is as follows:

  • New properties sold were 1,502 (8.06%)
  • Not new property sold were 17,139 (91.94%)


All Nottinghamshire Posts

Rutland Property Market 2015

 Story Highlights

  • Rutland had total property sales of £244 millions in 2015
  • The total number of properties sold in 2015 was 857
  • The average sales price in Rutland was £285 K, whereas median was £238 K
  • New Property sales were 20.15% by value, whereas Not New Property contributed 79.85%


Rutland has unitary authority status in East Midlands.  


Total Sales By Property Type

 Rutland - Total Sales By Property Type

Rutland had total property sales of £244 millions which was 1.46% of the East Midland Property Market 2015.

The split across its districts is as follows:

  • Detached at £155 millions (63.26%)
  • Semi-Detached at £36 millions (14.89%)   
  • Terraced at £42 millions (17.02%)
  • Flat/Maisonette at £6 millions (2.26%) 
  • Other at £6 millions (2.56%)


Total No Of Properties Sold By Property Type

Rutland - Total No Of Properties Sold By Property Type


The total property sales of £244 millions in 2015 was spread over 857 properties.

  • Detached at 423 (49.36%)
  • Semi-Detached at 170 (19.84%)
  • Terraced properties at 211 (24.62%)
  • Flat/Maisonette at 44 (5.13%)
  • Others at 9 (1.05%)


Average & Median Sales Price

Rutland - Average & Median Sales Price

The average sales price in Rutland was £285 K. For the different property types it was:

  • Detached at £366 K
  • Semi-Detached at £214 K
  • Terraced at £197 K
  • Flat/Maisonette at £125 K
  • Other at £697 K


Similarly median sales price in Rutland was £238 K.For the different property types it was:

  • Detached at £315 K
  • Semi-Detached at £195 K
  • Terraced at £173 K
  • Flat/Maisonette at £113 K
  • Other at £380 K


New Vs Not New Property Statistics

Rutland - New Vs Not New Property Statistics

By Sales Values the split is as follows:

  • New Properties contributed £49 millions (20.15%) 
  • Not New Property contributed £195 millions (79.85%)


By Total Number the split is as follows:

  • New properties sold were 190 (22.17%)
  • Not new property sold were 667 (77.83%)


 All East Midland Posts