For 2016 details - East Midlands Property Market 2016
Story Highlights
- East Midlands in 2015 had total property sales of £17 billions.
- The total number of property sold in East Midlands in 2015 was 85,071
- Across its counties total sales value was maximum at Leicestershire at £3.7 billions.
- The average property price was £197 K and the median was £157 K
- The average sales price at county level is maximum for Rutland at £285 K
- New properties contributed 13.05% by value and not new 86.95%
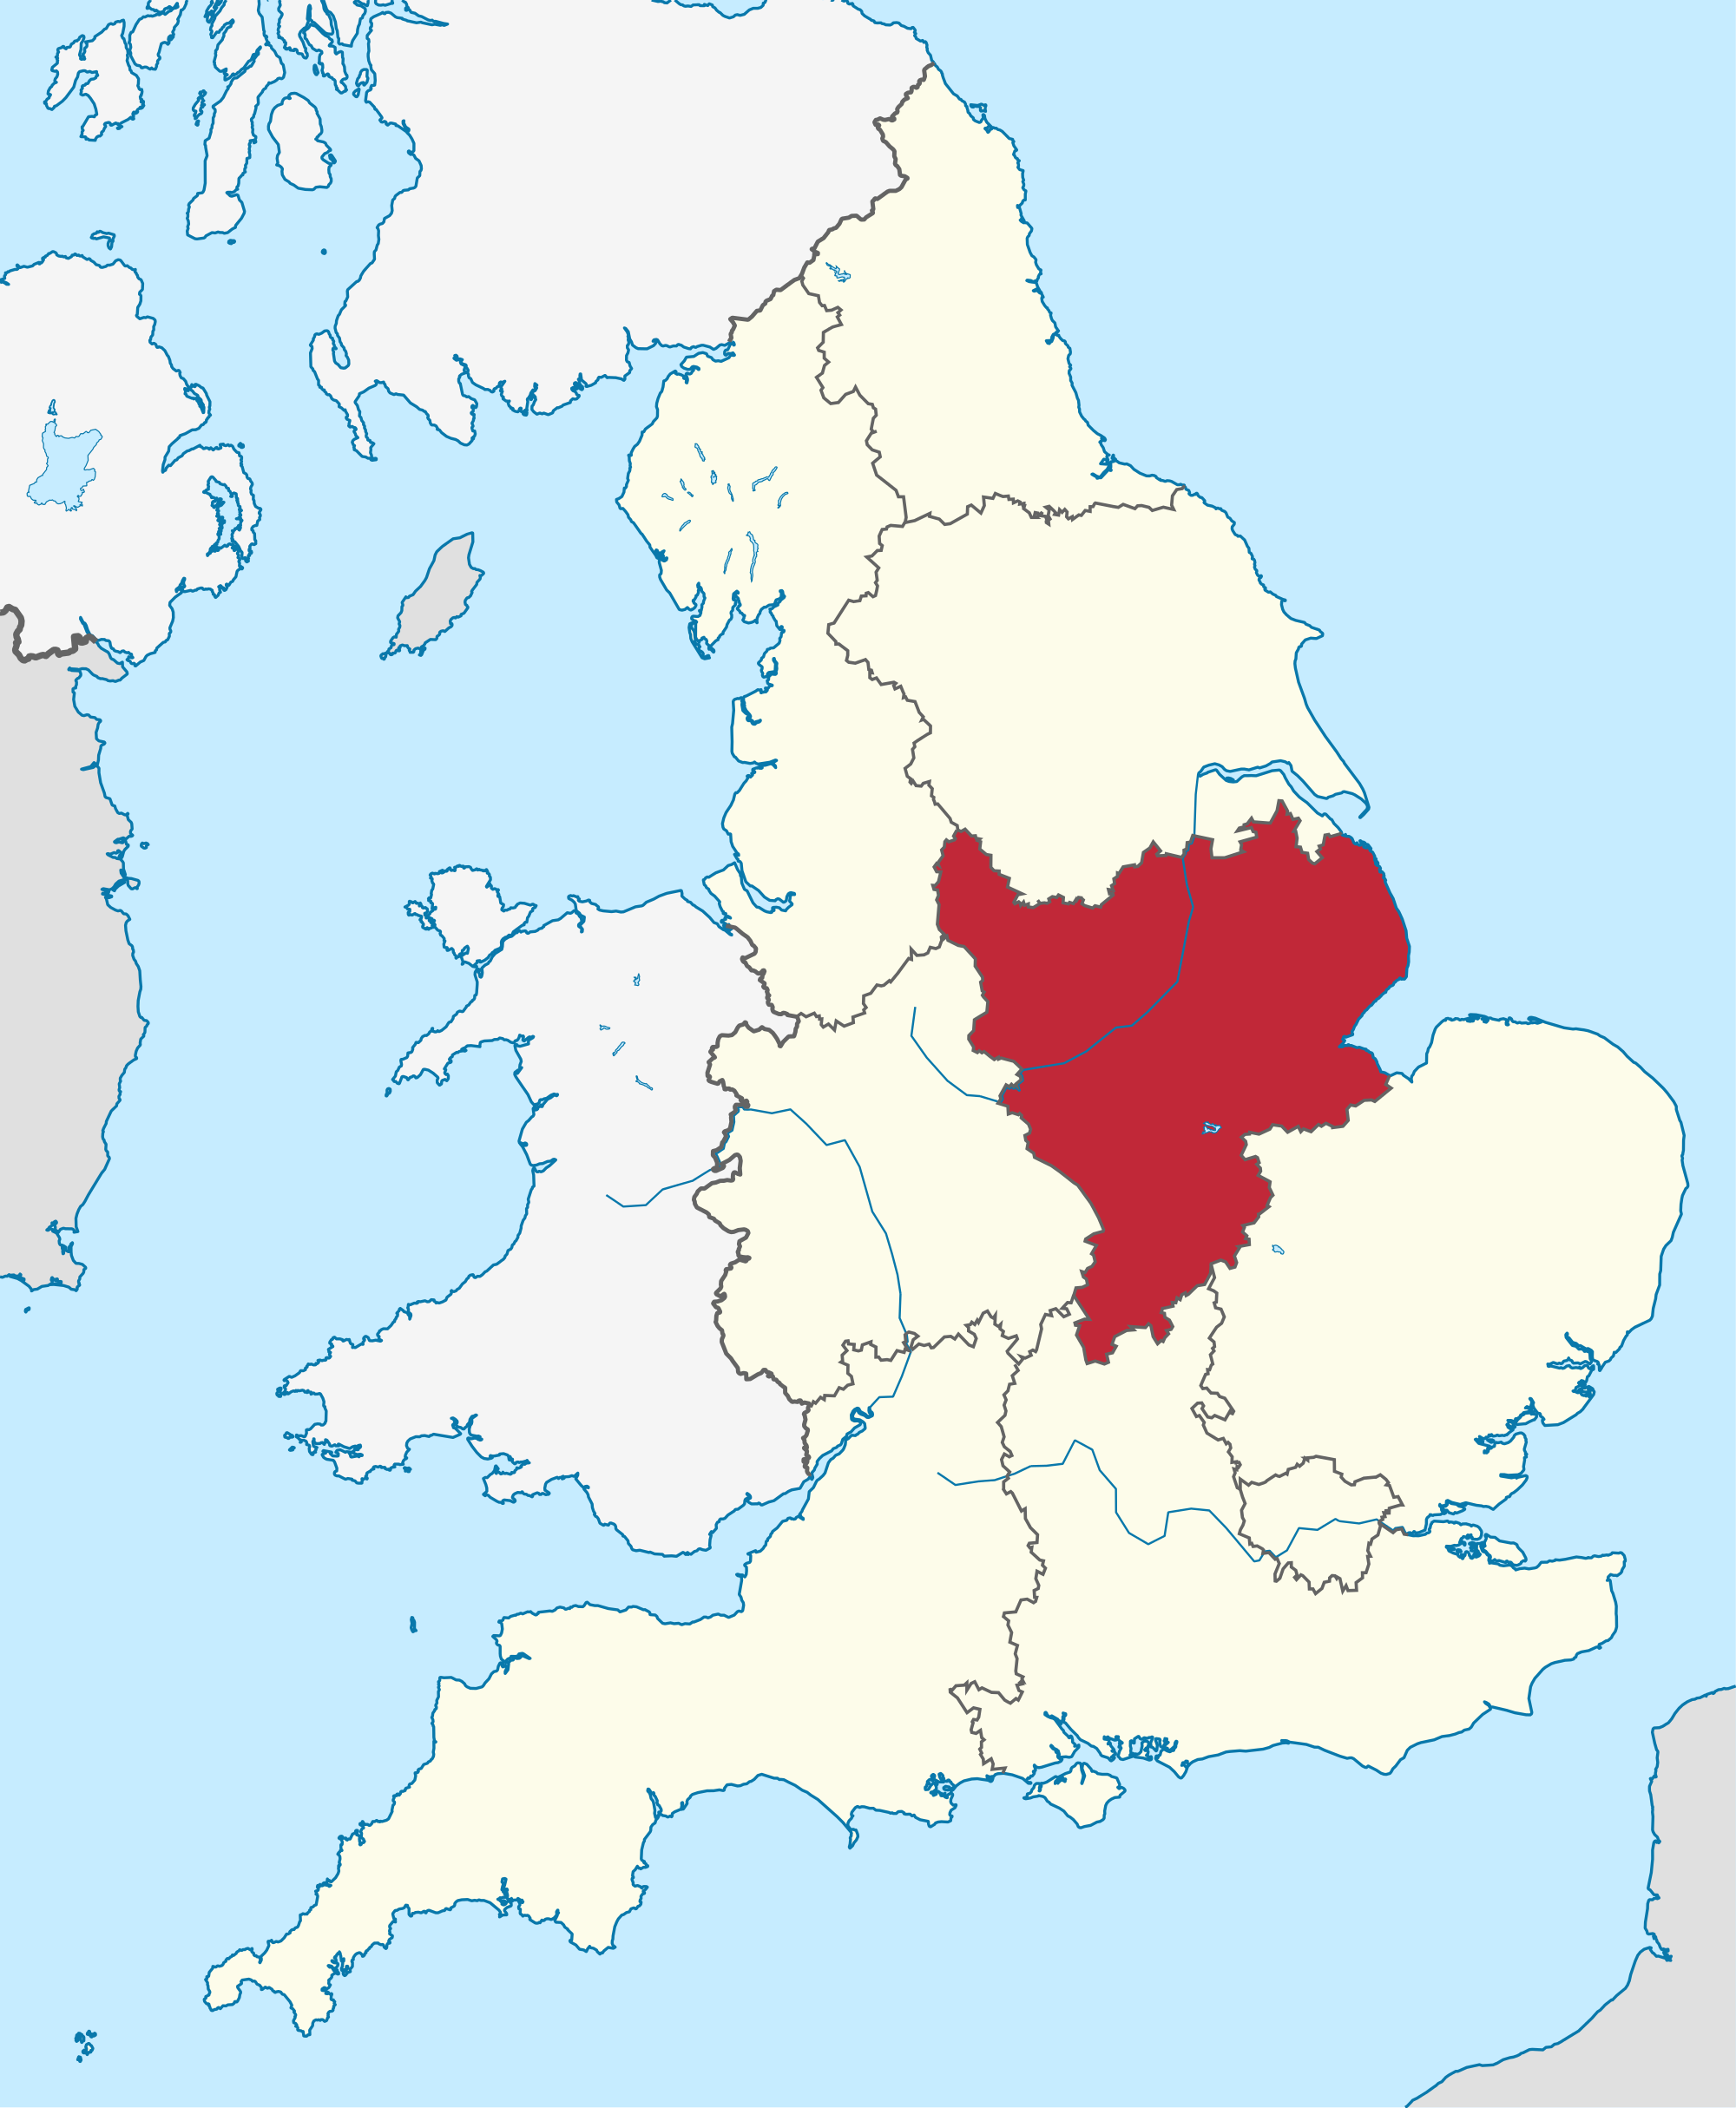
East Midlands is one of the 9 principal areas of England. It consists of Derbyshire, Nottinghamshire, Lincolnshire, Leicestershire, Rutland, Northamptionshire
Total Value of Sales By Property Types
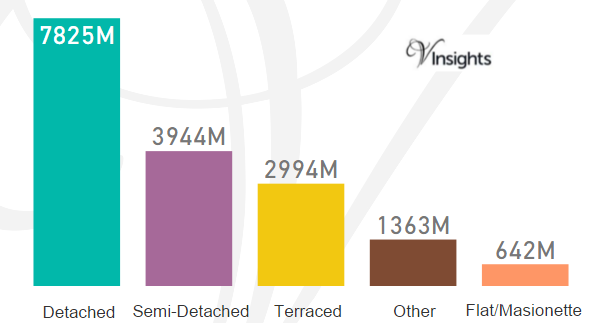
East Midlands in 2015 had total property sales of £17 billions. It is 5.68% of England and Wales Property Market 2015.
The split across the different property types are:
- Detached at £7.83 billions (46.67%)
- Semi-Detached at £3.944 billions (17.86%)
- Terraced at £2.994 billions (17.86 %)
- Other at £1.363 billions (8.13%)
- Flat/Maisonette at £0.64 billions (3.83%)
Total Sales By County
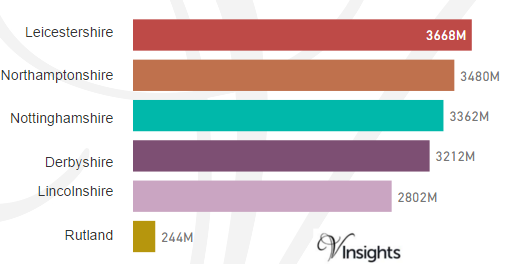
The total sales of £17 Billions in 2015 is split across its counties as above.
Total Number of Sales By Property Types
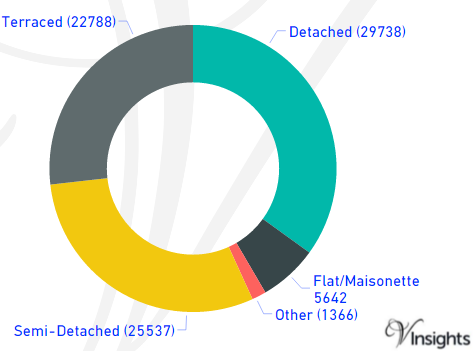
The total number of property sold in East Midlands in 2015 was 85,071.
The split is :
- Detached at 29,738 (34.96%),
- Semi-Detached at 25,537 (30.02%)
- Terraced at 22,788(26.79%)
- Flat/Maisonette at 5,642 (6.63%)
- Other at 1,366(1.61%)
Average & Median Sales Price
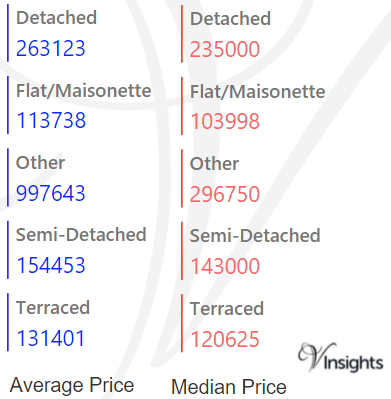
The average sales price in East Midlands was 197 K.
For the different property types it was
- Detached at £263 K
- Semi-Detached at £155 K
- Terraced at £131 K
- Flat/Maisonette at £114 K
- Other it is at £998 K
Similarly the median sales price in East Midlands was 157 K.
For the different property types it was
- Detached at £235 K
- Semi-Detached at £143 K
- Terraced at £121 K
- Flat/Maisonette at £104 K
- Other it is at £297 K
Average & Median Sales Price By County
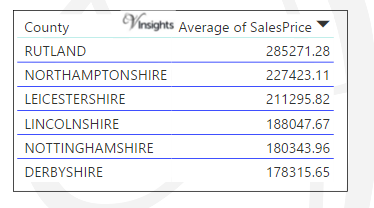
The average of sales price in East Midland at county level in 2015 is :
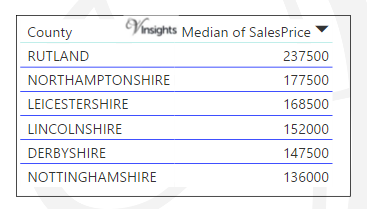
The median of sales price in East Midland at county level in 2015 is :
New Vs Not New Property Statistics
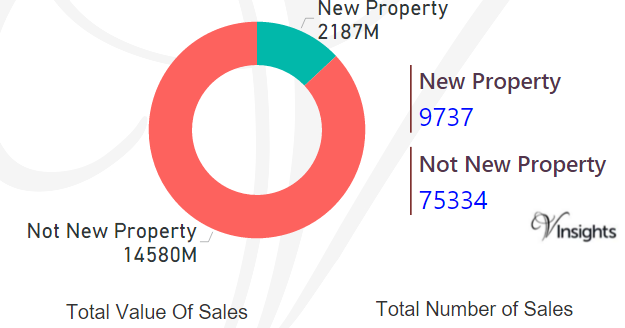
By Sales Value
- Sales value contributed by New Property was £2.187 billions (13.05%)
- where as Not New Property contributed £14.58 billions (86.95%)
By Number Of Sales
- New properties sold were 9,737 (11.54%)
- where as not new property sold were 75,334 (88.55%)
All England Posts
37c9566c-4152-4775-9ab9-975a034f935c|0|.0|27604f05-86ad-47ef-9e05-950bb762570c