Story Highlights
- Leicestershire had total property sales of £3.67 Billions in 2015.
- The total number of properties sold in 2015 in Leicestershire was 17,361
- The total volume of sales at district level was maximum for Leicester at £729 millions
- The average sales price in Leicestershire was £211 K, whereas median was £169 K
- The average sales price at district level was maximum for Harborough at £266 K
- The median sales price at district level was also maximum for Harborough at £230 K
- New Property sales in Leicestershire contributed 18.6% and Not New Property contributed 81.4%
Leicestershire is one of the counties of East Midlands. The districts of Leicestershire are Leicester, Charnwood, Hinckley and Bosworth, Harborough, North West Leicester, Blaby, Melton, Oadby And Wingston.
Total Sales By Districts
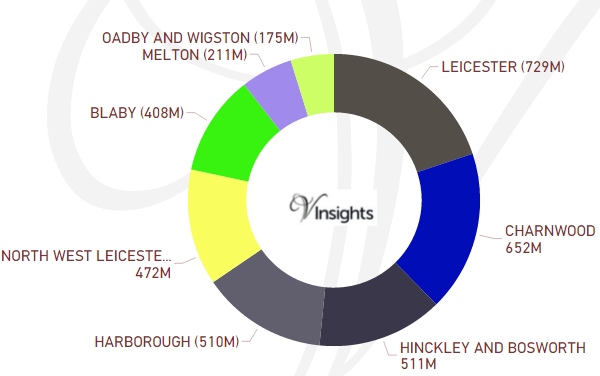
Leicestershire had total property sales of £3.67 Billions which was 21.88% of the East Midland Property Market 2015.
The split across its districts is as follow:
- Leicester at £729 millions
- Charnwood at £625 millions
- Hinckley and Bosworth at £511 millions
- Harborough at £510 millions
- North West Leicester at £472 millions
- Blaby at £408 millions
- Melton at £211 millions
- Oadby And Wingston at £175 millions
Total Sales By Property Type
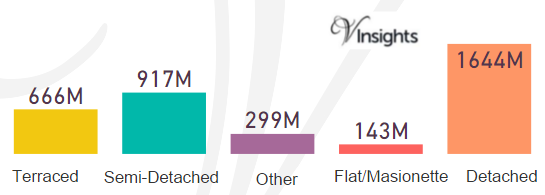
The split of £3.67 Billions across the different property types in Leicestershire are :
- Detached at £1.64 billions (44.82%)
- Semi-Detached at £917 millions (24.98%)
- Terraced at £666 millions (18.16%)
- Flat/Maisonette at £143 millions (3.89%)
- Other at £299 millions (8.15%)
Total No Of Properties Sold By Property Type
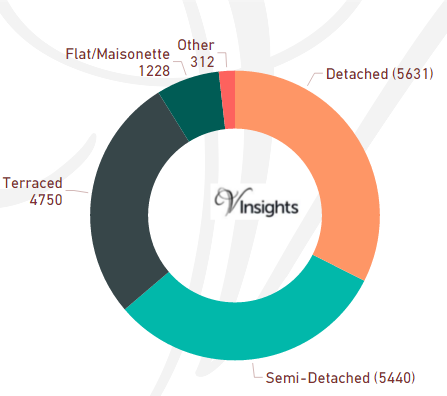
The total property sales of £3.67 Billions in 2015 was spread over 17,361 properties.
- Detached at 5631 (32.43%)
- Semi-Detached at 5440 (31.33%)
- Terraced properties at 4750 (27.36%)
- Flat/Maisonette at 1228 (7.07%)
- Others at 312 (1.8%)
Average & Median Sales Price
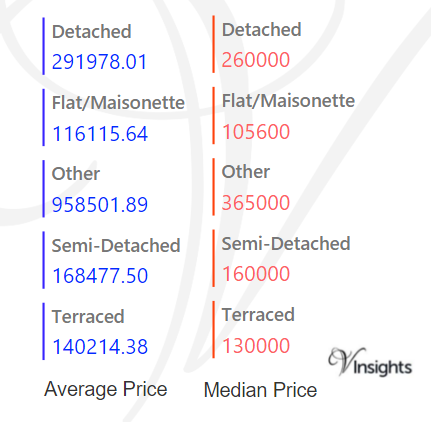
The average sales price in Leicestershire was £211 K. For the different property types it was:
- Detached at £292 K
- Semi-Detached at £169 K
- Terraced at £140 K
- Flat/Maisonette at £116 K
- Other at £959 K
Similarly median sales price in Leicestershire was £169 K. For different property types it was:
- Detached at £260 K
- Semi-Detached at £160 K
- Terraced at £130 K
- Flat/Maisonette at £106 K
- Other at £365 K
Average & Median Sales Price By Districts
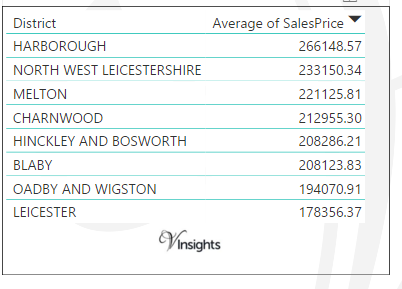
The average sales prices at district level in Leicestershire for 2015 is as follows:
- Harborough at £266 K
- North West Leicester at £233 K
- Melton at £221 K
- Charnwood at £213 K
- Hinckley and Bosworth at £208 K
- Blaby at £208 K
- Oadby And Wingston at £194 K
- Leicester at £178 K
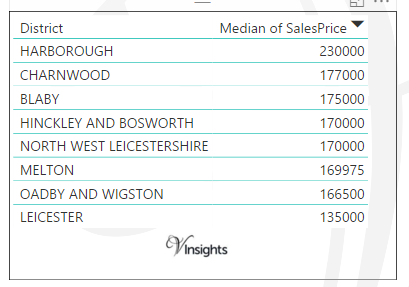
The median sales prices at district level in Leicestershire for 2015 is as follows:
- Harborough at £230 K
- Charnwood at £177 K
- Blaby at £175 K
- Hinckley and Bosworth at £170 K
- North West Leicester at £170 K
- Melton at £170 K
- Oadby And Wingston at £167 K
- Leicester at £135 K
New Vs Not New Property Statistics
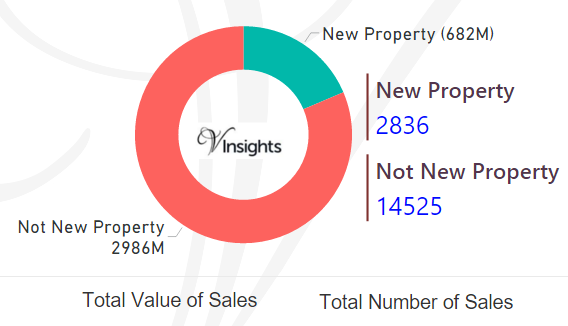
By Sales Values the split is as follows:
- New Properties contributed £682 millions (18.6%)
- Not New Property contributed £2.99 billions (81.4%)
By Total Number the split is as follows:
- New properties sold were 2836 (16.34%)
- Not new property sold were 14,525 (83.66%)
All Leicestershire Posts

619580df-5c23-4d58-b766-cf96b49bf7f8|0|.0|27604f05-86ad-47ef-9e05-950bb762570c