
Story Highlights
- East Midlands in 2016 had total property sales of £18 billions.
- The total number of properties sold in East Midlands in 2016 was 86,999
- Across its counties total sales value was maximum in Leicestershire at £3.98 billions.
- The average property price was £207 K and the median was £165 K
- The average sales price at county level is maximum for Rutland at £298 K
- New properties contributed 11.02% by value and not new properties contributed 88.98%
East Midlands is one of the 9 principal areas of England. It consists of Derbyshire, Nottinghamshire, Lincolnshire, Leicestershire, Rutland, Northamptonshire
Total Sales By County
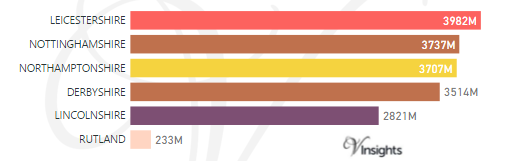
East Midlands in 2016 had total property sales of £18 billions. It is 6.05% of England and Wales Property Market 2016.
The split of £18 billions across its counties was:
Year on Year Comparison : Compared to East Midlands Property Market 2015 in 2016
- All counties had growth in total sales except Rutland
- Rutland had a decline of 4.5% over 2015
Total Value of Sales By Property Types
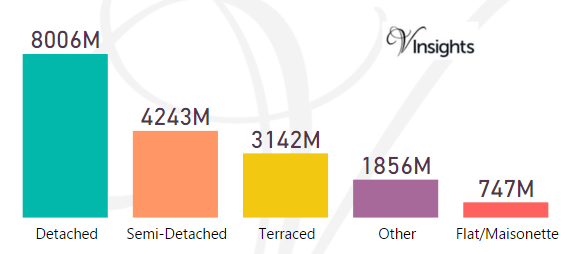
The split of £18 billions across the different property types are:
- Detached at £8 billions (44.49%)
- Semi-Detached at £4.24 billions (23.58%)
- Terraced at £3.14 billions (17.46%)
- Other at £1.86 billions (10.32%)
- Flat/Maisonette at £747 millions (4.15%)
Year on Year Comparison : Compared to East Midlands Property Market 2015 in 2016
- All property types have shown growth in total property sales value
Month-wise Break-up of Total Sales
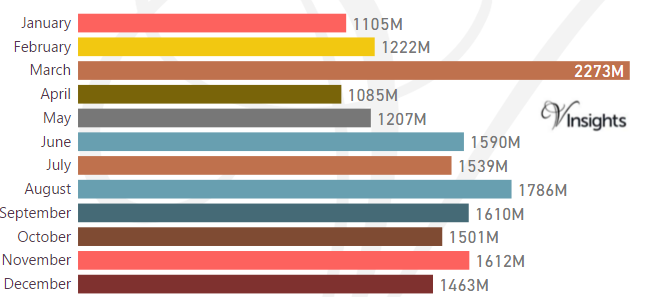
Stamp Duty Hike Impact
- March had property sale spike of £2.27 billions compared to £1.2 billions in Feb
- The impetus for it was to avoid the extra 3% in Stamp Duty Tax applicable on buying an additional home, being applicable from April 1 2016
Brexit Impact
- Brexit took place on 23rd June 2016.
- As can be observed from the month-wise break-up there does not seem to have been dip in property sales in the immediate aftermath of Brexit
- Year on year (compared to 2015) the growth was 5.88%
- So Brexit did not seem to negatively impact East Midlands Property Market 2016.
Total Number of Sales By Property Types
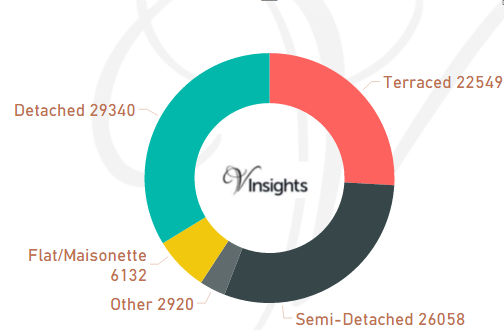
The total number of properties sold in East Midlands in 2016 was 86,999.
The split is :
- Detached at 29,340 (33.72%)
- Semi-Detached at 26,058 (29.95%)
- Terraced at 22,549 (25.92%)
- Flat/Maisonette at 6,132 (7.05%)
- Other at 2,920 (3.36%)
Year on Year Comparison : Compared to East Midlands Property Market 2015 in 2016
- All the property types sales have shown growth except Detached, Terraced
- Other has shown significant growth of 114%
Average & Median Sales Price
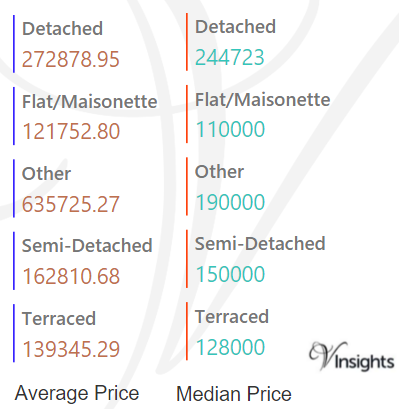
The average sales price in East Midlands was 207 K.
For the different property types it was
- Detached at £273 K
- Semi-Detached at £163 K
- Terraced at £139 K
- Flat/Maisonette at £122 K
- Other it is at £636 K
Similarly the median sales price in East Midlands was 165 K
For the different property types it was
- Detached at £245 K
- Semi-Detached at £150 K
- Terraced at £128 K
- Flat/Maisonette at £110 K
- Other it is at £190 K
Year on Year Comparison : Compared to East Midlands Property Market 2015 in 2016
- All property types have had increase in average and median sales prices except Other
Average & Median Sales Price By County
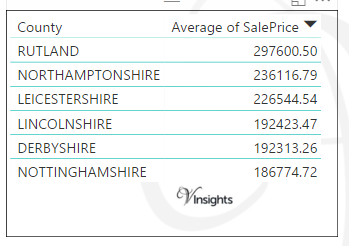
The average of sales price in East Midland at county level in 2016 is :
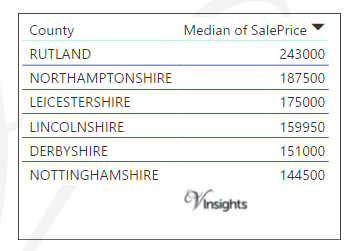
The median of sales price in East Midland at county level in 2016 is :
Year on Year Comparison : Compared to East Midlands Property Market 2015 in 2016
- The average and median price across all counties have gone up.
New Vs Not New Property Statistics
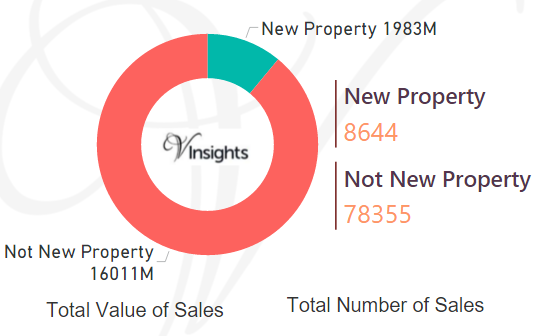
By Sales Value
- Sales value contributed by New Property was £1.98 billions (11.02%)
- where as Not New Property contributed £16 billions (88.98%)
By Number Of Sales
- New properties sold were 8,644 (9.94%)
- Not new property sold were 78,355 (90.06%)
Year on Year Comparison : Compared to East Midlands Property Market 2015 in 2016
- New property market share in property market has gone down in 2016 over 2015
All England Posts

41b30dc6-9adb-4026-825f-c46446e0f38f|0|.0|27604f05-86ad-47ef-9e05-950bb762570c