
Story Highlights
- North West England had total property sales of £23 billions in 2016
- Across its counties the maximum sale was in Greater Manchester at £8.7 billions
- The total number of properties sold in 2016 was 119,347
- In North West England the average sales price was £190 K, while median was £143 K
- The average sales price at county level was maximum in Cheshire East at £264 K
- New Property contribution by sales value was 7.5%, where as Not New was 92.49%
- Stamp duty hike caused monthly spike in March
- Brexit did not have impact on North West England property market in 2016
North West England is one of the 9 principal areas of England. It consists of Cheshire East, Cheshire West and Chester, Halton, Warrington, Cumbria, Greater Manchester, Lancashire, Blackpool, Blackburn With Darwen, Merseyside.
Total Sales By County
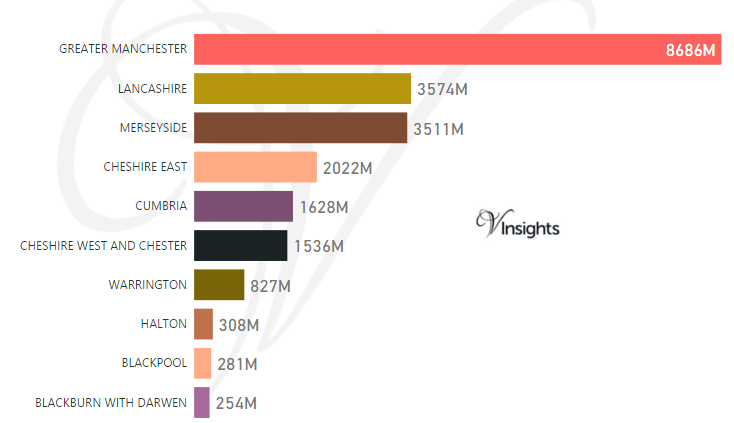
North West England had total property sales of £23 billions. It is 7.61% of England and Wales Property Market 2016.
The split of £23 billions across its counties as above.
Total Value of Sales By Property Types
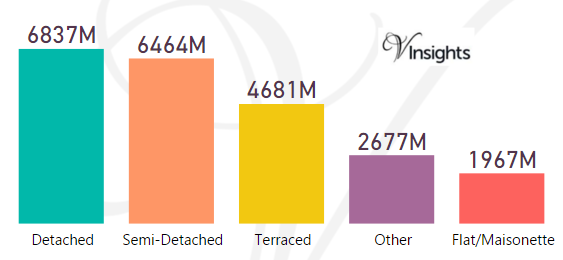
The split of £23 billions across its property types was :
- Detached at £6.84 billions (30.22%)
- Semi-Detached at £6.46 billions (28.57%)
- Terraced at £4.68 billions (20.69%)
- Other at £2.677 billions (11.83%)
- Flat/Maisonette at £1.967 billions (8.69%)
Year on Year Comparison : Compared to North West England Property Market 2015 in2016
- All the property types sales have shown growth.
Month-wise Break-up of Total Sales
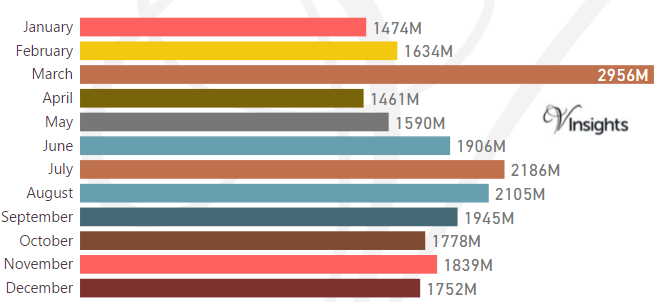
Stamp Duty Hike Impact
- March had property sale spike of £2.95 billions compared to £1.63 billions in Feb
- The impetus for it was to avoid the extra 3% in Stamp Duty Tax applicable on buying an additional home, being applicable from April 1 2016
Brexit Impact
- Brexit took place on 23rd June 2016.
- As can be observed from the month-wise break-up there does not seem to have been dip in property sales in the immediate aftermath of Brexit
- Compared to 2015 in 2016, the North West property market has shown a growth of 4.55%
- Brexit does not seem to have had negative impact on North West England property market
Total Number of Sales By Property Types
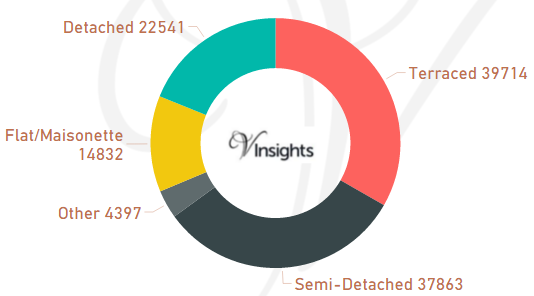
The total property sales of £23 billions in 2016 was spread over 119,347 properties.
- Terraced properties was at 39,714 (33.28%)
- Semi-Detached at 37,863 (31.73%)
- Detached at 22,541 (18.89%)
- Flat/Maisonette at 14,832 (12.43%)
- Other at 4,397 (3.68%)
Year on Year Comparison : Compared to North West England Property Market 2015 in 2016
- Total number of property sales in 2016 has increased by 1.27 %.
- All property types have shown increase in number of properties sold except property type Detached, Flat/Maisonette
Average & Median Sales Price
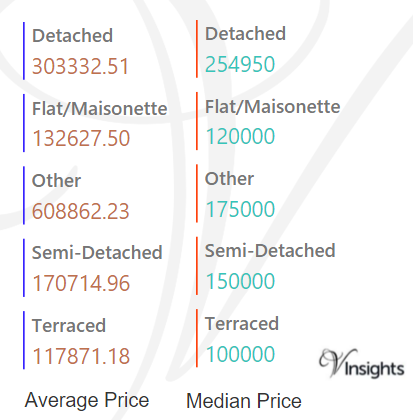
The average sales price in North West England in 2016 was £190 K.
For the different property types it was
- Detached at £303 K
- Semi-Detached at £171 K
- Terraced at £118 K
- Flat/Maisonette at £133 K
- Other it is at £609 K
Similarly median sales price in North West England in 2016 was £143 K.
For the different property types it was
- Detached at £255 K
- Semi-Detached at £150 K
- Terraced at £100 K
- Flat/Maisonette at £120 K
- Other it is at £175 K
Year on Year Comparison : Compared to North West England Property Market 2015 in 2016
- The average and median property prices have gone up except for property type Other
Average & Median Sales Price By County
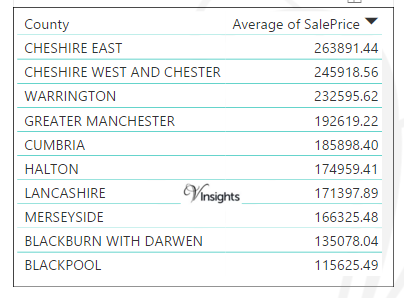
The average sales price in 2016 at county level in North West England was
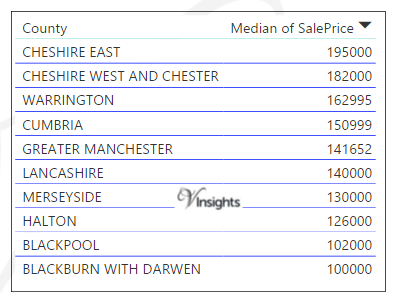
The median sales price in 2016 at county level in North West England is as above.
Year on Year Comparison : Compared to North West England Property Market 2015 in 2016
- The average sales price across all the counties have gone up except for Halton,Blackburn With Darwen.
- The median sales price across all the counties have gone up.
New Vs Not New Property Statistics
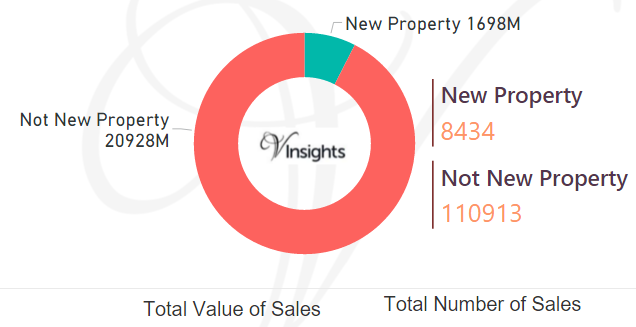
By Total Values Of Sales
- Sales value contributed by New Property was £1.7 billions (7.51%)
- Not New Property contributed £20.93 billions (92.49%)
By Total Number Of Sales
- New properties sold were 8,434 (7.07%)
- Not new property sold were 110,913 (92.93%)
Year on Year Comparison : Compared to North West England Property Market 2015
- New property market share in property market has gone down in 2016 over 2015
All North West England Posts

04b38768-02e1-4278-8033-2235072f6220|0|.0|27604f05-86ad-47ef-9e05-950bb762570c