
Story Highlights
- Yorkshire and Humber had total property sales of £17 Billions
- The number of properties sold was 88,650 properties
- Across counties the maximum sales is in West Yorkshire at £6.95 billions
- The average property price was £190 K and the median was £145 K
- The average sales price at County level is maximum for York at £267 K
- New properties contributed 8.6% by value and not new property 91.4%
- Stamp duty hike caused monthly spike in March
- Brexit coupled with Stamp Duty Hike did not have negative impact on Yorkshire and Humber Property Market in 2016
Yorkshire and Humber is one of the 9 principal areas of England. It comprises of South Yorkshire, West Yorkshire, North Yorkshire, York, East Riding of Yorkshire, Kingston upon Hull, North Lincolnshire, North East Lincolnshire.
Total Sales By County
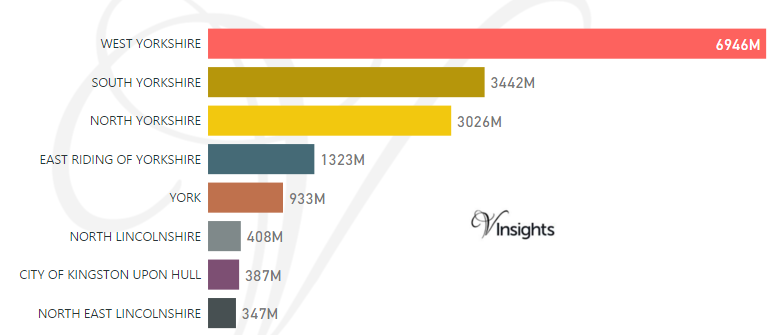
Yorkshire and Humber had total property sales of £17 Billions. It contributed 5.66% of the England and Wales Property Market 2016.
The total sales of £17 billions in 2016 was split across its counties as above.
Year on Year Comparison : Compared to Yorkshire and Humber Property Market 2015 in 2016
- Decline in total sales has been in York, City of Kingston Upon Hull
Total Value of Sales By Property Types
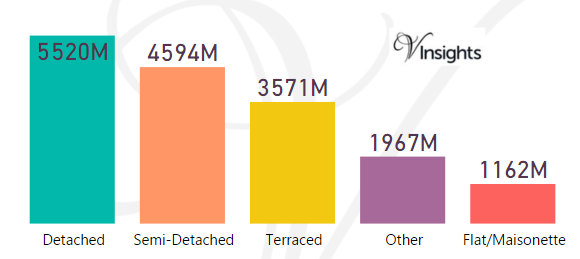
The split of £17 billions across the different property types was
- Detached at £5.52 billions (32.83%)
- Semi-Detached at £4.59 billions (27.32%)
- Terraced at £3.57 billions (21.24%)
- Other at £1.97 billions (11.7%)
- Flat/Maisonette at £1.16 billions (6.91%)
Year on Year Comparison : Compared to Yorkshire and Humber Property Market 2015 in 2016
- Only Terraced Property Types had decline
- Total Sales has shown growth of 6.25%
Month-wise Break-up of Total Sales
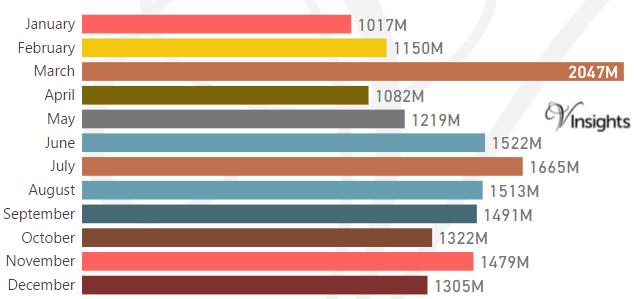
Stamp Duty Hike Impact
- March had property sale spike of £2.05 billions compared to £1.15 billions in Feb
- The impetus for it was to avoid the extra 3% in Stamp Duty Tax applicable on buying an additional home, being applicable from April 1 2016
Brexit Impact
- Brexit took place on 23rd June 2016.
- As can be observed from the month-wise break-up there does not seem to have been dip in property sales in the immediate aftermath of Brexit
- Year on Year growth over the last year has been 6.25% so there has been no negative Brexit impact
Total Number of Sales By Property Types
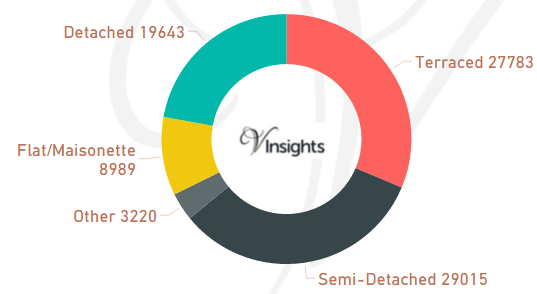
The total property sales of £17 Billions in 2016 was spread over 88,650 properties.
- Terraced properties at 27,783 (31.34%)
- Semi-Detached at 29,015 (32.73%)
- Detached at 19,643 (22.16%)
- Flat/Maisonette at 8,989 (10.14%)
- Others at 3,220 (3.63%)
Year on Year Comparison : Compared to Yorkshire and Humber Property Market 2015 in 2016
- Total number of property sales in 2016 has decreased by 1.04%
- All property types have shown decline in number of properties sold except property type Terraced, Other
- Other has shown significant increase of 123%
Average & Median Sales Price
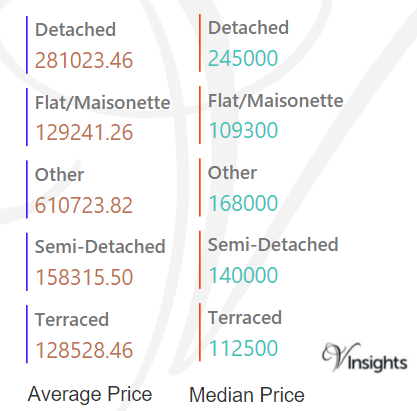
The average sales price in Yorkshire and Humber was £190 K. For the different property types it was
- Detached at £281 K
- Semi-Detached at £158 K
- Terraced at £129 K
- Flat/Maisonette at £129 K
- Other it is at £610 K
The median sales price was £145 K and for different property types it was
- Detached at £245 K
- Semi-Detached at £140 K
- Terraced at £113 K
- Flat/Maisonette at £109 K
- Other at £168 K
Year on Year Comparison : Compared to Yorkshire and Humber Property Market 2015 in 2016
- The average and median property prices have gone up except for property type Other
Average & Median Sales Price By County
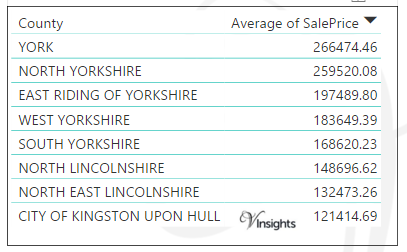
The average sales price by county in Yorkshire and Humber 2016 is as above.
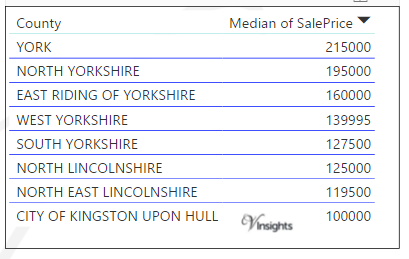
The median sales price by county in Yorkshire and Humber 2016 is as above.
Year on Year Comparison : Compared to Yorkshire and Humber Property Market 2015 in 2016
- Broadly the sale price across the counties has gone up
New Vs Not New Property Statistics
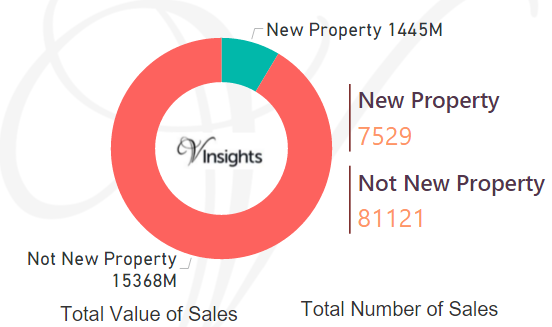
By Value of Sales
- The sales value contributed by New Property was £1.45 billions (8.6%)
- where as Not New Property contributed £15.4 billions (91.4%)
By Number of Sales
- New properties sold were 7,529 (8.49%)
- where as not new property sold were 81,121(91.51%)
Year on Year Comparison : Compared to Yorkshire and Humber Property Market 2015 in 2016
- New property market share in property market has gone down in 2016 over 2015
All England Posts

c73f1d82-9b16-406b-b549-d464edccd947|0|.0|27604f05-86ad-47ef-9e05-950bb762570c