Story Highlights
- Portsmouth had total property sales of £972 millions in 2016
- The year-on-year growth compared to 2015 was 3.4%
- The total number of properties sold in 2016 was 3,921
- The average sales price in Portsmouth was £248 K, whereas the median was £187 K
- New Property sales were 4.98% by value, whereas Not New Property contributed 95.02%
- Stamp duty hike caused monthly spike in March
Portsmouth has unitary authority status in South East England.
Total Sales By Property Type
 Portsmouth had total property sales of £972 millions which was 1.57% of the total South East property Market in 2016.
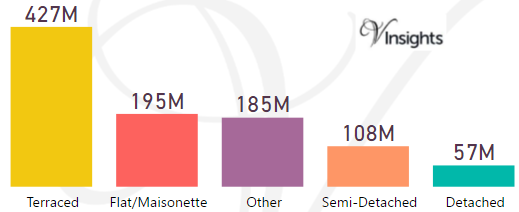
The split of £972 millions in Portsmouth across the different property types are:
- Terraced £427 millions (43.98%)
- Flat/Maisonette £195 millions (20.03%)
- Semi-Detached £108 millions (11.14%)
- Detached £57 millions (5.85%)
- Other £185 millions (19%)
Year on Year Comparison : Compared to Portsmouth Property Market 2015 in 2016
- All the property types sales have shown growth except Other.
Oxford Property Market at Postcode Level
| Postcode |
Coverage Area |
School |
Local Authority Area |
| PO1 |
Portsmouth, Fratton, Old Portsmouth, Portsea, Landport |
Details |
Portsmouth |
| PO2 |
Portsmouth, Hilsea, North End, Tipner, Stamshaw |
Details |
Portsmouth |
| PO3 |
Portsmouth, Hilsea, Baffins, Copnor, Anchorage Park |
Details |
Portsmouth |
| PO4 |
Southsea, Milton, Eastney |
Details |
Portsmouth |
| PO5 |
Southsea |
Details |
Portsmouth |
| PO6 |
Cosham, Drayton, Farlington |
Details |
Portsmouth |
Month-wise Break-up of Total Sales
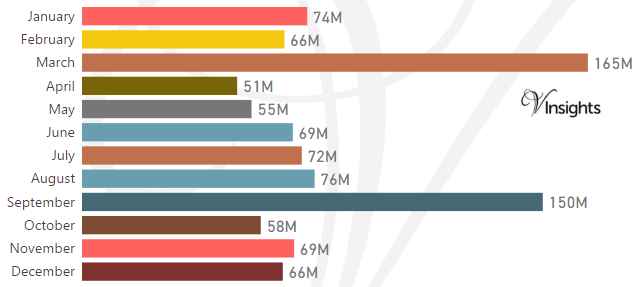
Some of the insights based on the £972 millions month-wise break-down :
Stamp Duty Hike Impact
- March had property sale spike of £165 millions compared to £66 millions in Feb
- The impetus for it was to avoid the extra 3% in Stamp Duty Tax applicable on buying an additional home, being applicable from April 1 2016
Brexit Impact
- Brexit took place on 23rd June 2016.
- Year on Year growth (compared to 2015) has been 3.4% in 2016 despite Brexit
- Brexit coupled with Stamp Duty Hike did not have negative impact on Portsmouth Property Market in 2016
Total No Of Properties Sold By Property Type
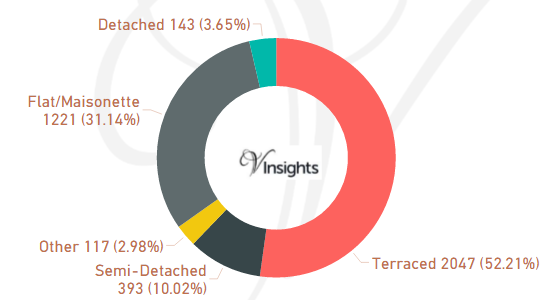
Portsmouth had total property sales of 3,921. The split across different property types are:
- Terraced 2,047 (52.21%)
- Semi-Detached 393 (10.02%)
- Flat/Maisonette 1,221 (31.14%)
- Detached 143 (3.65%)
- Other 117 (2.98%)
Year on Year Comparison : Compared to Portsmouth Property Market 2015 in 2016
- Total number of property sales in 2016 has decreased by %.
- All property types have shown growth in number of properties sold except property type Detached, Terraced.
- Other has shown growth of 105.26%
Average & Median Sales Price
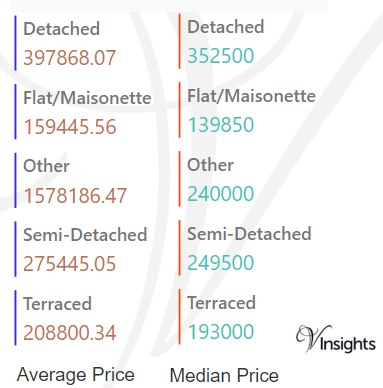
The average sales price in Portsmouth was £248 K. For the different property types it was
- Detached at £398 K
- Semi-Detached at £275 K
- Terraced at £209 K
- Flat/Maisonette at £159 K
- Other it is at £1.6 millions
Similarly median sales price in Portsmouth was £187 K. For different property types it was
- Detached at £353 K
- Semi-Detached at £250 K
- Terraced at £193 K
- Flat/Maisonette at £140 K
- Other it is at £240 K
Year on Year Comparison : Compared to Portsmouth Property Market 2015 in 2016
- The average and median property prices have gone up except for property type Other.
- Other had massive decline in average and median property price
New Vs Not New Property Statistics
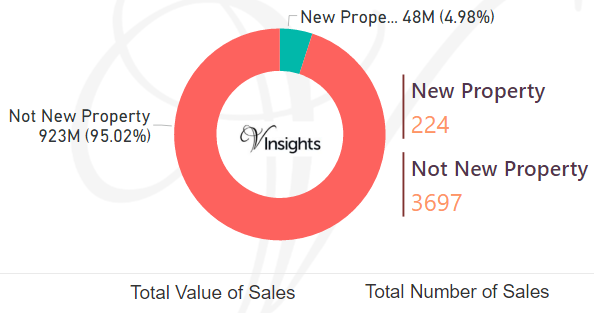
By Sales Value the split is as follows:
- New Property contributed £48 millions (4.98%)
- Not New Property contributed £923 millions (95.02%)
By Total Number the split is as follows:
- New properties sold were 224 (5.71%)
- Not new property sold were 3,697 (94.29%)
Year on Year Comparison : Compared to Portsmouth Property Market 2015 in 2016
- New property market share in property market has gone up
All South East England Posts

6d40522b-0c25-49e3-ae5c-c357ac5434ac|0|.0|27604f05-86ad-47ef-9e05-950bb762570c