Story Highlights
- Havering had total Property Sales of £1.5 billions in 2016.
- The total number of properties sold in year 2016 was 4002.
- The Average property price was £376 K while Median was £330 K
- Not New Property Contributed 93.89% and New Property 6.11%
- Stamp duty changes caused monthly spike in March
- Brexit and Stamp Duty changes had no immediate impact, Havering Property Market Grows 6.4% 2016
Havering is one of the Boroughs of East London. It had total Property Sales of £1.5 billions which was 9.16% of East London Property Market 2016.
Total Sales By Property Type
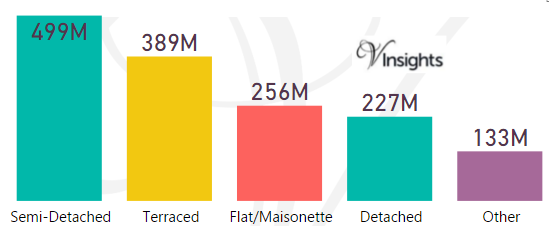
The split of £1.5 billions across the different property types are:
- Semi-Detached £499 millions (33.17%)
- Terraced £389 millions (25.85%)
- Flat/Maisonette £256 millions (17.04%)
- Detached £227 millions (15.07%)
- Other £133 millions (8.87%)
Year on Year Comparison : Compared to Havering Property Market 2015 in 2016
- All the property types have shown growth in sales except Semi-Detached, Detached
- Others has significant growth of 161%
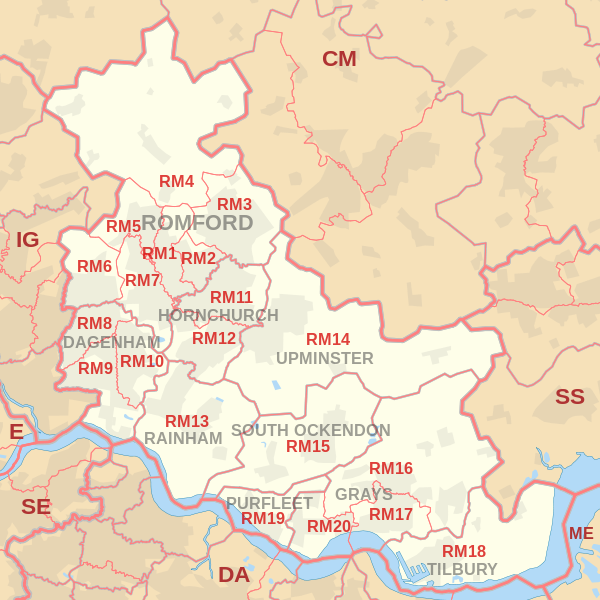
Havering Property Market at Postcode level
 |
| Postcode |
Coverage Area
|
Local Authority Area |
| CM13 |
Brentwood, East Horndon, Great Warley, Herongate, Hutton, Ingrave, Little Warley, West Horndon
|
Basildon, Brentwood, Havering |
| RM1 |
Romford, Rise Park
|
Havering |
| RM2 |
Gidea Park, Heath Park
|
Havering |
| RM3 |
Harold Wood, Harold Hill, Noak Hill, Harold Park
|
Havering |
| RM4 |
Havering-atte-Bower, Abridge, Stapleford Abbotts, Noak Hill, Navestock, Stapleford Tawney, Stapleford Aerodrome
|
Havering, Epping Forest, Brentwood |
| RM5 |
Collier Row
|
Havering, Redbridge |
| RM6 |
Chadwell Heath, Marks Gate, Little Heath, Goodmayes (north), Hainault (South)
|
Barking and Dagenham, Redbridge, Havering |
| RM7 |
Rush Green, Mawneys, Romford
|
Havering, Barking and Dagenham |
| RM11 |
Hornchurch, Emerson Park, Ardleigh Green
|
Havering |
| RM12 |
Hornchurch, Elm Park
|
Havering |
| RM13 |
Rainham, South Hornchurch, Wennington
|
Havering |
| RM14 |
Upminster, Cranham, North Ockendon, Bulphan
|
Havering, Thurrock |
For property market details at post code level please click on Postcode in the table above.
Month-wise Break-up of Total Sales
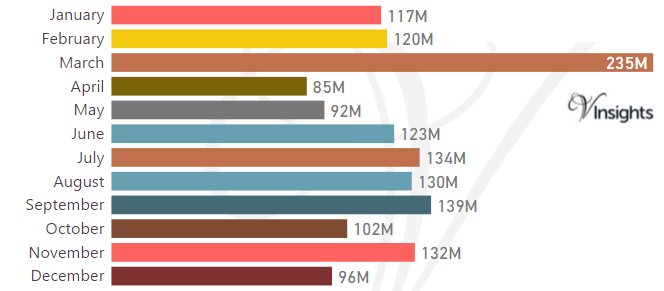
Stamp Duty Hike Impact
- March had property sale spike of £235 millions compared to £120 millions in Feb
- The impetus for it was to avoid the extra 3% in Stamp Duty Tax applicable on buying an additional home, being applicable from April 1 2016
Brexit Impact
- Brexit took place on 23rd June 2016.
- As can be observed from the month-wise break-up there does not seem to have been dip in property sales in the immediate aftermath of Brexit
- Year on Year the property market for Havering has shown growth of 6.4% year on year over 2015
Total No Of Properties Sold By Property Type
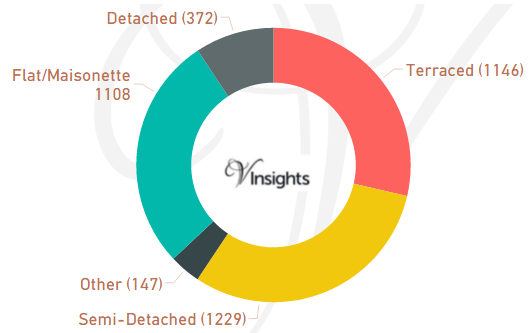
In Havering the total number of properties sold in year 2016 was 4002. The breakdown by different property types are:
- Terraced 1146 (28.64%)
- Semi-Detached 1229 (30.71%)
- Other 147 (3.67%)
- Flat/Maisonette 1108 (27.69%)
- Detached 372 (9.3%).
Year on Year Comparison : Compared to Havering Property Market 2015 in 2016
- Total number of property sales in Havering has declined by 10.35%
- All property types have shown decline in number of properties sold except property type Other
- Other has shown significant growth by 177%.
Average & Median Sales Price
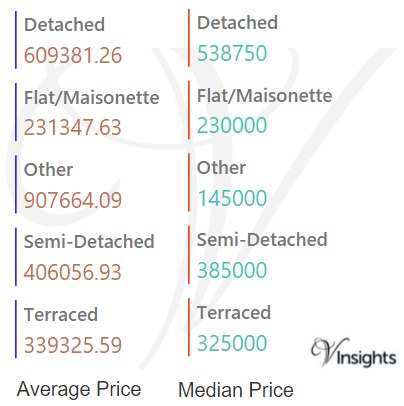
In 2016 the Average property price was £376 K in Havering. The average price for the different property types are:
- Detached £609 K
- Flat/Maisonette £231 K
- Other £907 K
- Semi-Detached £406 K
- Terraced £339 K
The Median Price was £330 K. The median property price for the different property types are:
- Detached £539 K
- Flat/Maisonette £230 K
- Other £145 K
- Semi-Detached £385 K
- Terraced £325 K
Year on Year Comparison : Compared to Havering Property Market 2015 in 2016
- The average and median sales price across all property types have gone up except for others
- Median Price for Others has shown a sharp decline
New Vs Not New Property Statistics
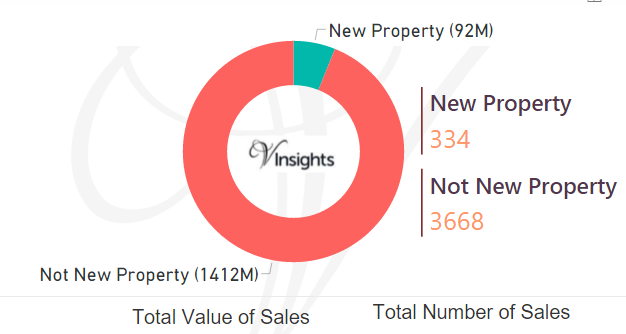
By Value Of Sales
- Not New Property £1.4 billion (93.89%)
- New Property £92 millions (6.11%)
By Number Of Sales
- The number of Not New Property sold was 3668 (91.65%)
- The number of New Properties sold was 334 (8.35%)
Year on Year Comparison : Compared to Havering Property Market 2015 in 2016
- New property market share in property market has gone down in 2016 over 2015
All London Posts
ce7d7090-c340-4508-8e1c-7e68ee80ad09|0|.0|27604f05-86ad-47ef-9e05-950bb762570c