Story Highlights
- Eastbourne had total property sales of £601 millions in 2016
- The total number of properties sold in 2016 was 2,432 properties
- The average sales price in Eastbourne was £247 K
- New Property sales were 2.56% by value, where as Not New 97.44%
- Stamp duty hike caused monthly spike in March
- Brexit coupled and Stamp Duty Hike did not have negative impact , there was growth of 7.5% in 2016 over 2015
Eastbourne is one of the districts of East of Sussex
Total Sales By Property Type
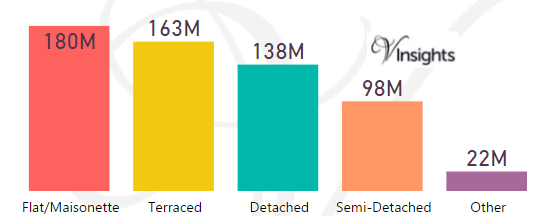
Eastbourne had total property sales of £601 millions which was 17.33% of the East of Sussex Property Market 2016
The split across the different property types are:
- Flat/Maisonette £180 millions (29.98%)
- Terraced £163 millions (27.13%)
- Detached £138 (22.97%)
- Semi-Detached £98 millions (16.32%)
- Other £22 millions (3.61%)
Eastbourne Property Market at Postcode level
| Postcode |
Coverage Area |
School |
Local Authority Area |
| BN20 |
Eastbourne,Beachy Head,East Dean,Friston, Old Town , Ratton,Wannock,Willingdon |
Details |
Eastbourne, Wealden |
| BN21 |
Eastbourne, Old Town |
Details |
Eastbourne |
| BN22 |
Eastbourne,Hampden Park,Willingdon |
Details |
Eastbourne, Wealden |
| BN23 |
Eastbourne, Friday Street,Langney,Sovereign Harbou r |
Details |
Eastbourne |
Month-wise Break-up of Total Sales
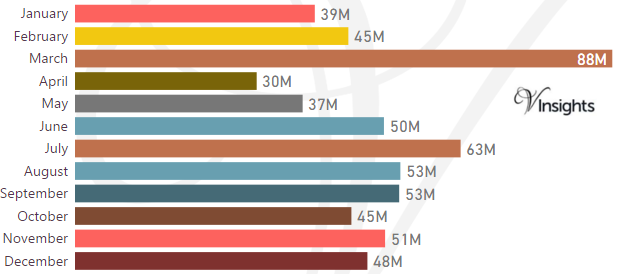
Some of the insights based on the £601 millions month-wise break-down :
Stamp Duty Hike Impact
- March had property sale spike of £88 millions compared to £45 millions in Feb
- The impetus for it was to avoid the extra 3% in Stamp Duty Tax applicable on buying an additional home, being applicable from April 1 2016
Brexit Impact
- Brexit took place on 23rd June 2016.
- As can be observed from the month-wise break-up there does not seem to have been dip in property sales in the immediate aftermath of Brexit
- Year on Year growth has been 7.51%in 2016 over 2015
- So Brexit and Stamp Duty changes did not have negative impact on the Eastbourne Property Market in 2016
Total No Of Properties Sold By Property Type
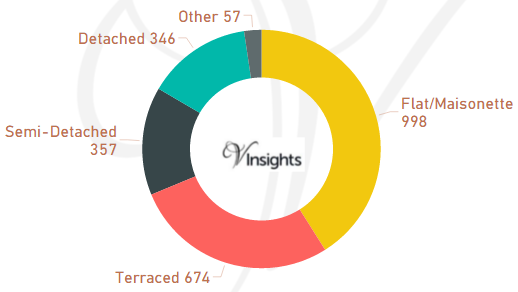
The total property sales of £601 millions in 2016 was spread over 2,432 properties.
- Flat/Maisonette 998 (41.04%)
- Terraced 674 (27.71%)
- Semi-Detached 357 (14.68%)
- Detached 346 (14.23%)
- Other 57 (2.34%)
Average & Median Sales Price
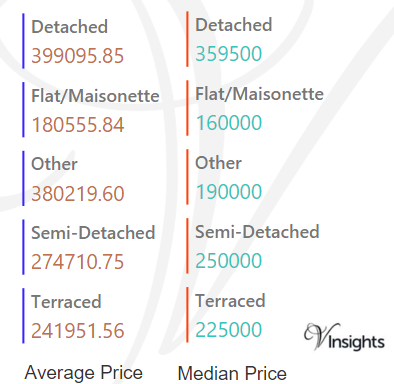
The average sales price in Eastbourne was £247 K and for the different property types it was:
- Detached £399 K
- Semi-Detached £275 K
- Terraced £242 K
- Flat/Maisonette £181 K
- Other it was £380 K
Similarly median sales price in Eastbourne was £220 K and for the different property types was:
- Detached £360 K
- Semi-Detached £250 K
- Terraced £225 K
- Flat/Maisonette £160 K
- Other it is £190 K
New Vs Not New Property Statistics
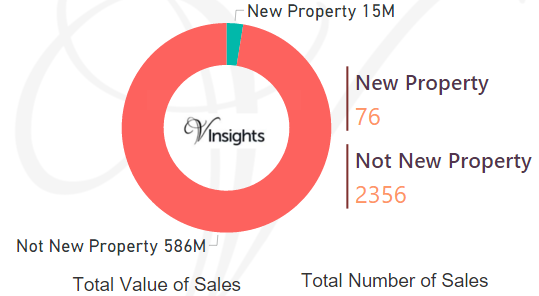
By Sales Values the split is as follows:
- New Property contributed £15 millions (2.56%)
- Not New Property contributed £586 millions (97.44%)
By Total Number the split is as follows:
- New properties sold were 76 (3.13%)
- Not new property sold were 2,356 (96.88%)
All East of Sussex Posts

18164052-99fc-4772-9da5-c4957a48263c|0|.0|27604f05-86ad-47ef-9e05-950bb762570c