Story Highlights
- Oxford had total property sales of £876 millions in 2016
- The average sales price was £541 K, whereas the median was £380 K
- New Property sales were 2.52% by value, whereas Not New Property contributed 97.48%
- Stamp duty changes caused monthly spike in March
- Brexit coupled with Stamp Duty changes had negative impact.
- Year on Year the property market for Oxford declined by 5.25% compared to 2015
Oxford is one of the districts of Oxfordshire.
Total Sales By Property Type
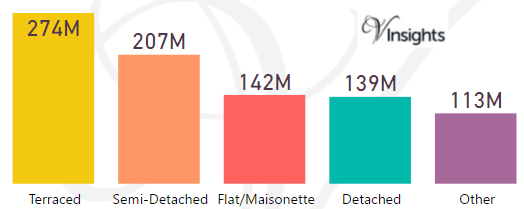
Oxford had total property sales of £876 millions which was 18.62% of the total Oxfordshire Property Market 2016
The split of £876 millions across the different property types are:
- Terraced £274 millions (31.28%)
- Semi-Detached £207 millions (23.64%)
- Flat/Maisonette £142 millions (16.27%)
- Detached £139 millions (15.92%)
- Other £113 millions (12.89%)
Oxford Property Market at Postcode Level
| Postcode |
Coverage Area
|
School |
Local Authority Area |
| OX1 |
Central and South Oxford, Kennington, Boars Hill, New Hinksey, South Hinksey, Osney
|
Details |
Oxford, Vale of White Horse |
| OX2 |
North and West Oxford, Botley, North Hinksey, Summertown, Wytham, Jericho, Wolvercote |
Details |
Oxford, Vale of White Horse, Cherwell |
| OX3 |
North East Oxford, Beckley, Headington, Marston, Elsfield, Noke, Woodeaton, Woodperry |
Details |
Oxford, South Oxfordshire, Cherwell |
| OX4 |
East Oxford, Cowley, Blackbird Leys, Littlemore Sandford-on-Thames, Iffley, Rose Hill |
Details |
Oxford, South Oxfordshire |
Month-wise Break-up of Total Sales
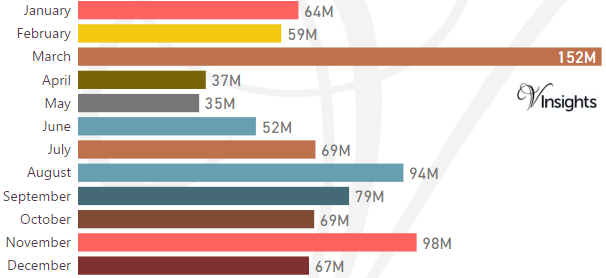
Some of the insights based on the £876 millions month-wise break-down :
Stamp Duty Hike Impact
- March had property sale spike of £152 millions compared to £59 millions in Feb and then sales sharply drop
- The impetus for it was to avoid the extra 3% in Stamp Duty Tax applicable on buying an additional home, being applicable from April 1 2016
Brexit Impact
- Brexit took place on 23rd June 2016.
- Year on Year decline has been 5.25 % in 2016 over 2015
- Brexit coupled with Stamp Duty Hike had negative impact on Oxford Property Market in 2016
Total No Of Properties Sold By Property Type
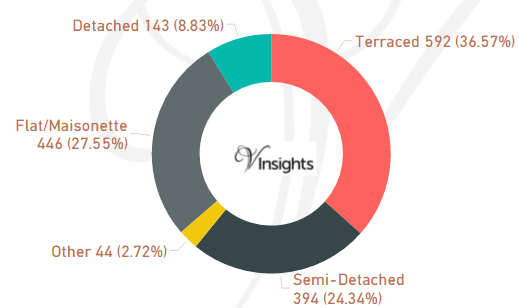
Oxford had total property sales of 1,619. The split across the different property types are:
- Terraced 592 (36.57%)
- Flat/Maisonette 446 (27.55%)
- Semi-Detached 394 (24.34%)
- Detached 143 (8.83%)
- Other 44 (2.72%)
Average & Median Sales Price
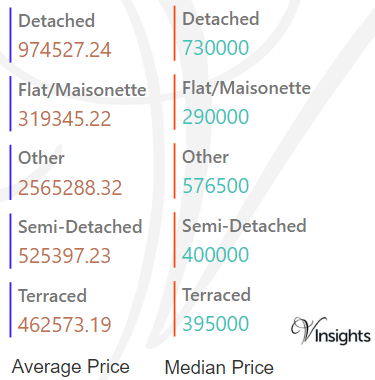
The average sales price in Oxford was £541 K and for different property types it was:
- Detached £975 K
- Semi-Detached £525 K
- Terraced £463 K
- Flat/Maisonette £319 K
- Other it is £2.6 millions
Similarly median sales price in Oxford was £380 K and for different property types are:
- Detached £730 K
- Semi-Detached £400 K
- Terraced £395 K
- Flat/Maisonette £290 K
- Other it is £577 K
New Vs Not New Property Statistics
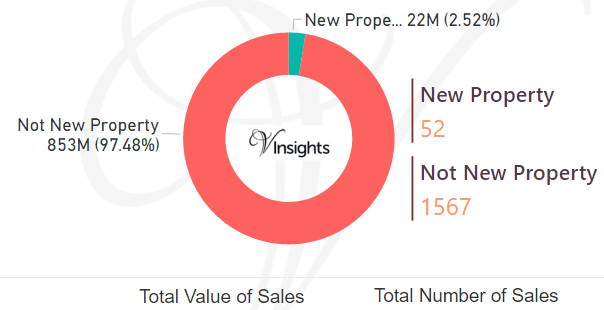
By Sales Value the split is as follows:
- New Property contributed £22 millions (2.52%)
- Not New Property contributed £853 millions (97.48%)
By Total Number the split is as follows:
- New properties sold were 52 (3.21%)
- Not new property sold were 1,567 (96.79%)
All Oxfordshire Posts

c68314ea-0368-47e2-8433-a0cd464683e0|0|.0|27604f05-86ad-47ef-9e05-950bb762570c