For 2016 details - Kent Property Market 2016
Story Highlights
- Kent had total property sales of £8.75 Billions in 2015
- The total number of properties sold in 2015 was 30,003.
- The average sales price in Kent was £291.76 K, whereas the median was £236 K
- Across it's districts average sales price was maximum for Sevenoaks at £466 K and minimum for Thanet at £204 K
- New Property sales were 9.73% by value, whereas Not New Property contributed 90.27%.
Kent is one of the counties of South East England.The districts of Kent are Tunbridge Wells, Maidstone, Sevenoaks, Tonbridge and Malling, Canterbury, Ashford, Dartford, Thanet, Swale, Dover, Shepway, Gravesham. Let us look at the Kent Property Market for 2015 in detail.
Total Sales By Districts
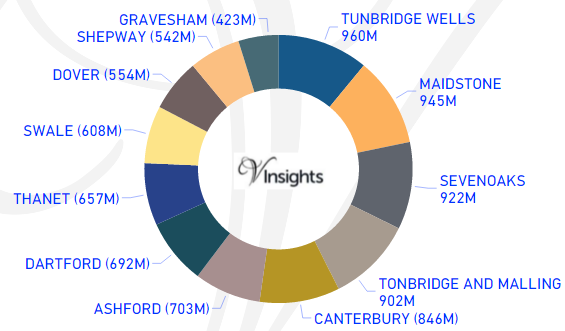
Kent had total property sales of £8.75 Billions which was 14.29% of the total South East property Market in 2015.
The split of the sales across the different districts was:
- Tunbridge Wells £960 millions (10.97%)
- Maidstone £945 millions (10.8%)
- Sevenoaks £922 millions (10.53%)
- Tonbridge and Malling £902 millions (10.3%)
- Canterbury £846 millions (9.67%)
- Ashford £703 millions (8.03%)
- Dartford £692 millions (7.9%)
- Thanet £657 millions (7.5%)
- Swale £608 millions (6.95%)
- Dover £554 millions (6.33%)
- Shepway £542 millions (6.19%)
- Gravesham £ 423 millions (4.83%)
Total Sales By Property Type
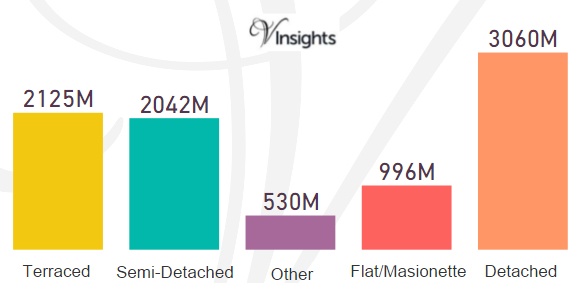
The split by Sales value across the different property types in Kent are:
- Terraced £2.13 billions (24.28%)
- Semi-Detached £2.04 billions (23.32%)
- Other £530 millions (6.06%)
- Flat/Maisonette £996 millions (11.38%)
- Detached £3.06 billions (34.96%)
Total No Of Properties Sold By Property Type
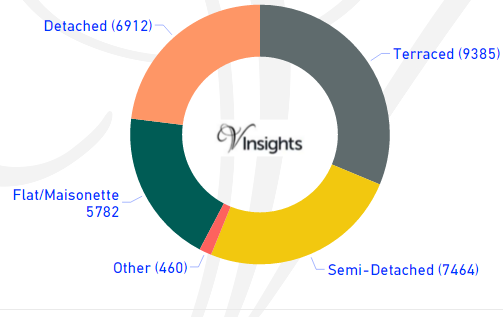
Kent had total property sales of 30,003. The split across the different property types are:
- Detached 6,912 (23.04%)
- Flat/Maisonette 5,782 (19.27%)
- Other 460 (1.53%)
- Semi-Detached 7464 (24.88%)
- Terraced 9385 (31.28%)
Average & Median Sales Price
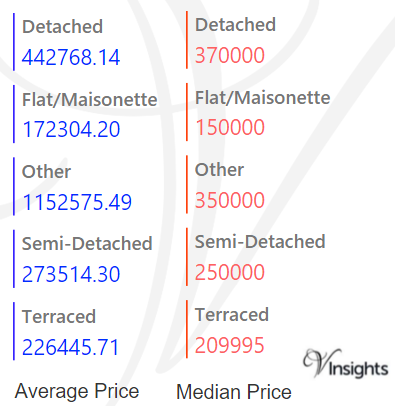
The average sales price in Kent was £291.76 K and for the different property types it was:
- Detached £443 K
- Semi-Detached £274 K
- Terraced £226 K
- Flat/Maisonette £172 K
- Other it is £1.15 million
Similarly median sales price in Kent was £236 K and for the different property types it was:
- Detached £370 K
- Semi-Detached £250 K
- Terraced £210 K
- Flat/Maisonette £150 K
- Other it is £350 k
Average & Median Sales Price By Districts
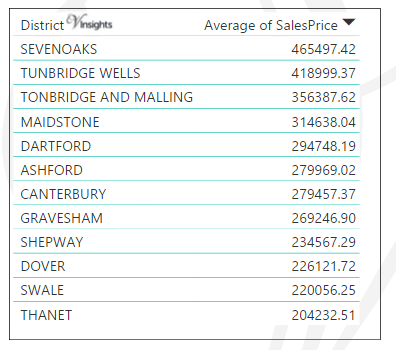
Across districts the average price is as above.
- The maximum average sales price is for Sevenoaks at £466 K
- Tunbridge Wells £419 K
- Tonbridge And Malling £356 K
- Maidstone £314 K
- Dartford £295 K
- Ashford £280 K
- Canterbury £280 K
- Gravesham £269 K
- Shepway £234 K
- Dover £226 K
- Swale £220 K
- Minimum for Thanet at £204 K
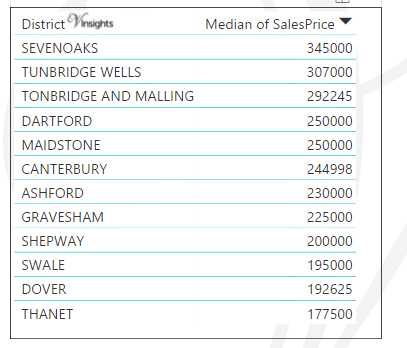
Across districts the median price is as above.
- The maximum average sales price is for Sevenoaks at £345 K
- Tunbridge Wells £307 K
- Tonbridge And Malling £292 K
- Dartford £250 K
- Maidstone £250 K
- Canterbury £245 K
- Ashford £230 K
- Gravesham £225 K
- Shepway £200 K
- Swale £195 K
- Dover £193 K
- Minimum for Thanet at £178 K
New Vs Not New Property Statistics
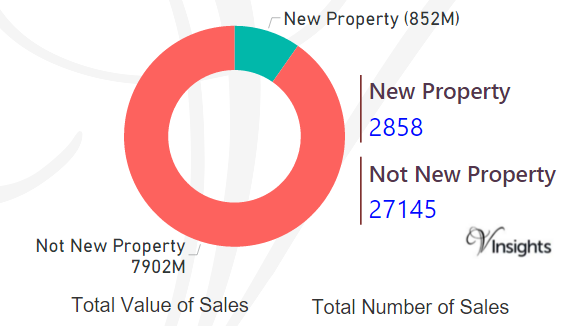
By Sales Values the split is as follows:
- New Property contributed £852 millions (9.73%)
- Not New Property contributed £7.9 billions (90.27 %)
By Total Number the split is as follows:
- New properties sold were 2,858 (9.53%)
- Not new property sold were 27,145 (90.47%)
All Kent Posts

058d4416-a542-495a-9948-77d02de3d2d7|0|.0|27604f05-86ad-47ef-9e05-950bb762570c