Story Highlights
- Hartlepool had total Property Sales of £194 millions in 2015
- The total number of properties sold in year 2015 was 1505
- The Average property price was £129 K, while Median was £110 K
- Not New Property contributed 77.04% by value and New Property 22.96% by value
Hartlepool has unitary authority status in North East England.
Total Sales By Property Type
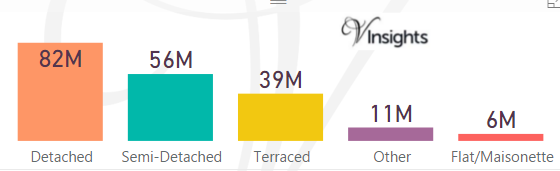
Hartlepool had total property sales of £194 millions which was 2.86% of the North East Property Market 2015.
The split across the different property types was :
- Detached at £82 millions (42.18%)
- Semi-Detached at £56 millions (28.73%)
- Terraced at £39 millions (20.31%)
- Other at £11 millions (5.76%)
- Flat/Maisonette at £6 millions (3.01%)
Total No Of Properties Sold By Property Type
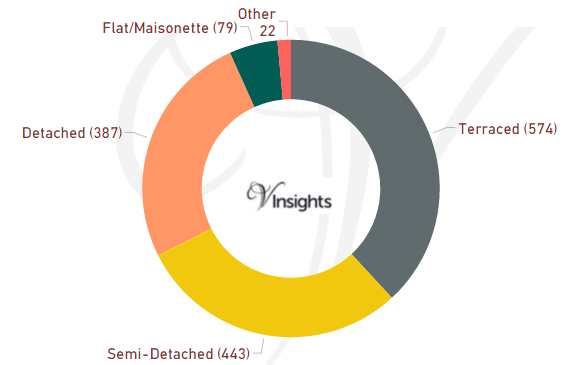
In Hartlepool the total number of properties sold in year 2015 was 1505. The breakdown by different property types are:
- Terraced 574 (38.14%)
- Semi-Detached 443 (29.44%)
- Detached 387 (25.71%)
- Flat/Maisonette 79 (5.25%)
- Other 22 (1.46%)
Average & Median Sales Price
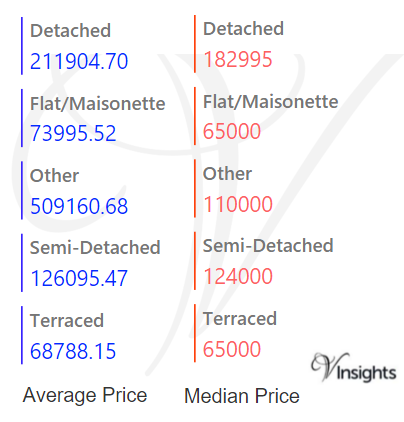
The average sales price in Hartlepool was £129 K.
For the different property types it was
- Detached at £212 K,
- Semi-Detached at £126 K
- Terraced at £69 K
- Flat/Maisonette at £74 K
- Other at £509 K.
Similarly median sales price in Hartlepool was £110 K.
For the different property types it was
- Detached at £183 K
- Semi-Detached at £124 K
- Terraced at £65 K
- Flat/Maisonette at £65 K
- Other at £110 K
New Vs Not New Property Statistics
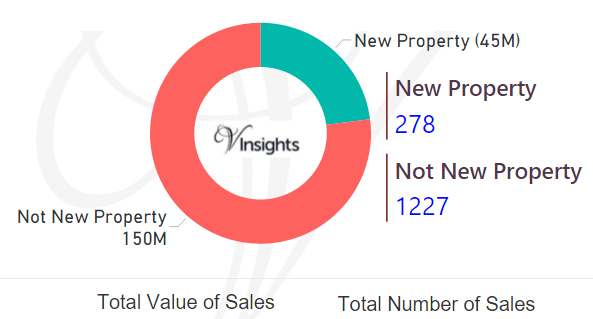
By Value of Sales
- The sales value contributed by New Property was £45 millions (22.96%)
- where as Not New Property contributed £150 millions (77.04%).
By Number of Sales
- New properties sold were 278 (18.47%)
- where as not new property sold were 1227 (81.53%).
All North East England Posts

73108bca-05b6-4ee6-b484-15ff55fd8617|0|.0|27604f05-86ad-47ef-9e05-950bb762570c