Story Highlights
- Islington in 2016 had total property sales of £2.24 billions
- The total number of property sold in Islington was 2616
- The average sales price in Islington was £855.3 K and the median sales price was £600 K
- The sales value contributed by New Property was 17.2% where as Not New Property contributed 82.8%
- Stamp duty changes caused monthly spike in March
- Brexit coupled with Stamp duty hike arrested total property sales growth to 1% in 2016
Total Sales By Property Type
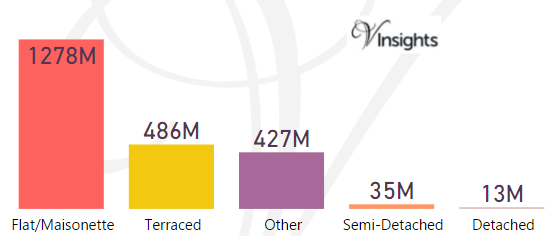
Islington is one of the Boroughs of Central London. It had total Property Sales of £2.24 billions which was 9.06% of Central London Property Market 2016
The split across the different property types are:
- Flat/Maisonette £1.28 billions (57.11%)
- Terraced £486 millions (21.7%)
- Other £427 millions (19.07%)
- Semi-Detached £35 millions (1.55%)
- Detached £13 millions (0.58%)
Year on Year Comparison : Compared to Islington London Property Market 2015 in 2016
- Terraced, Semi-Detached, Detached had lower total sales compared to 2015
- Flat/Maisonette, Other had higher total sales compared to 2015
Islington Property Market at Postcode level
| Postcode |
Coverage Area
|
Local Authority Area |
| EC1A |
St Bartholomew's Hospital
|
City Of London, Islington |
| EC1M |
Clerkenwell, Farringdon |
Islington, Camden, City of London |
| EC1R |
Finsbury, Finsbury Estate (west) |
Islington, Camden |
| EC1V |
Finsbury (east), Moorfields Eye Hospital |
Islington, Hackney |
| EC1Y |
St Luke's, Bunhill Fields |
Islington, City of London |
| EC2A |
Shoreditch |
Islington, Hackney, City of London |
| N1 |
Barnsbury (part), Canonbury, Kings Cross, Islington, Pentonville, De Beauvoir Town, Hoxton |
Hackney, Islington, Camden |
| N6 |
Highgate, Hampstead Heath (part) |
Camden, Haringey, Islington |
| N7 |
Holloway, Barnsbury (part), Islington (part), Tufnell Park (part) |
Islington, Camden |
| N8 |
Hornsey, Crouch End, Harringay (part) |
Haringey, Islington |
| N16 |
Stoke Newington, Stamford Hill (part), Shacklewell, Dalston (part), Newington Green (part) |
Islington, Hackney, Harrow |
| N19 |
Upper Holloway, Archway, Tufnell Park (part) |
Islington, Camden |
| NW5 |
Kentish Town district: Kentish Town, Camden Town (part), Gospel Oak (part), Dartmouth Park, Chalk Farm (east), Tufnell Park (west) |
Camden, Islington |
| WC1X |
Kings Cross, Finsbury (west), Clerkenwell (north) |
Camden, Islington |
Month-wise Break-up of Total Sales
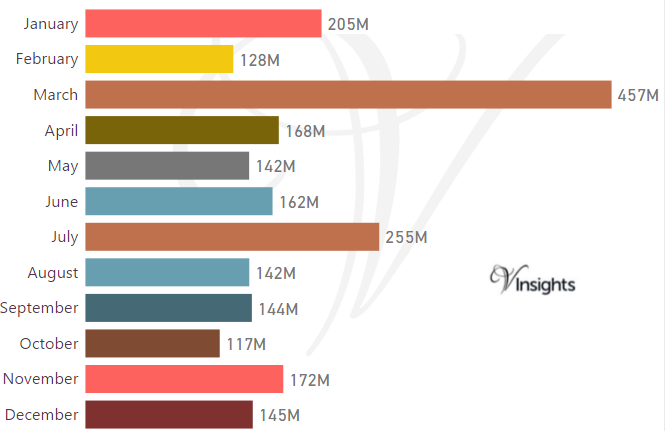
Some of the insights based on the £2.24 billions month-wise break-down :
Stamp Duty Hike Impact
- March had property sale spike of £ 457 millions compared to £ 128 millions in Feb
- The impetus for it was to avoid the extra 3% in Stamp Duty Tax applicable on buying an additional home, being applicable from April 1 2016
Brexit Impact
- Brexit took place on 23rd June 2016.
- As can be observed from the month-wise break-up there does seem to have been some dip in property sales in the immediate aftermath of Brexit
- Year on Year the property market for Islington has shown growth of 1.339% over 2015
Total No Of Properties Sold By Property Type
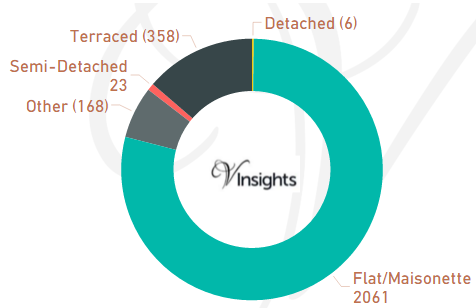
In Islington the total number of properties sold in year 2016 was 2616. The breakdown by different property types are:
- Terraced 358 (13.69%)
- Semi-Detached 23 (0.88%)
- Other 168 (6.42%)
- Flat/Maisonette 2061 (78.78%)
- Detached 6 (0.23%)
Year on Year Comparison : Compared to Islington London Property Market 2015 in 2016
- Total sales volume has increased by 19 i.e. 0.73%
- All the property types except Flat/Maisonette and Other had lower sales volume compared to 2015
- Others and Flat/Maisonette had increase in property sales compared to 2015
Average & Median Sales Price
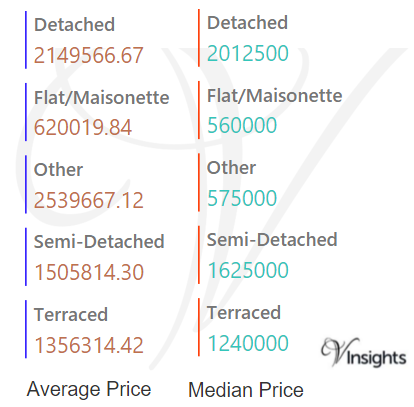
In 2016 the Average property price was £855.3 K in Islington. The average price for the different property types are:
- Detached £2.15 millions
- Flat/Maisonette £620 K
- Other £2.54 millions
- Semi-Detached £1.5 millions
- Terraced £1.36 millions
The Median Price was £600 K. The median property price for the different property types are:
- Detached £2.01 millions
- Flat/Maisonette £560 K
- Other £575 K
- Semi-Detached £1.63 millions
- Terraced £1.24 millions
Year on Year Comparison : Compared to Islington London Property Market 2015 in 2016
- All property types have generally shown increase in property price except property type Other
New Vs Not New Property Statistics
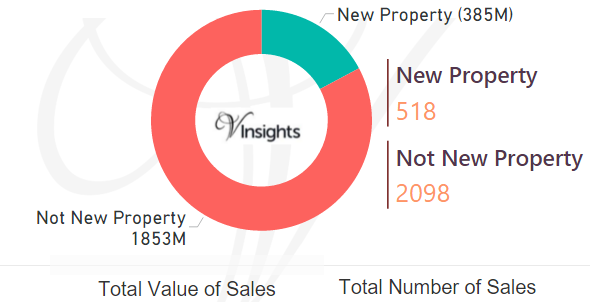
By Value Of Sales
- Not New Property contributed £1.85 billion (82.8%)
- New Property £385 millions (17.2%)
By Number Of Sales
- The number of Not New Property sold was 2098 (80.2%)
- The number of New Properties sold was 518 (19.8%)
Year on Year Comparison : Compared to Islington London Property Market 2015 in 2016
- New property market share in property market has gone up in 2016 over 2015
All London Posts
5aaac71d-6bac-4611-a145-9b274b0e847b|0|.0|27604f05-86ad-47ef-9e05-950bb762570c