Story Highlights
- Southwark in 2016 had total property sales of £3.16 billions
- The total number of property sold in Southwark 2016 was 3892
- The average sales price in Southwark was £813 K and the median sales price was £504 K
- The sales value contributed by New Property was 19.84% where as Not New Property contributed 80.16%
- Stamp duty changes caused monthly spike in March
- Brexit and Stamp duty changes have not had impact and total sales value has increased by 9%
Total Sales By Property Type
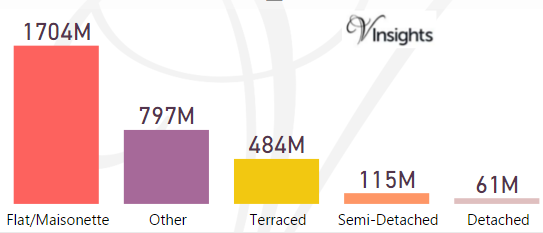
Southwark is one of the Boroughs of Central London. It had total Property Sales of £3.16 billions which was 12.81% of Central London Property Market 2016.
The split across the different property types are:
- Terraced £484 millions (15.32%)
- Semi-Detached £115 millions (3.65%)
- Other £797 millions (25.2%)
- Flat/Maisonette £1.7 billions (53.9%)
- Detached £61 millions (1.93%)
Year on Year Comparison : Compared to Southwark Property Market 2015 in 2016
- All the property type had lower total sales compared to 2015 except Others
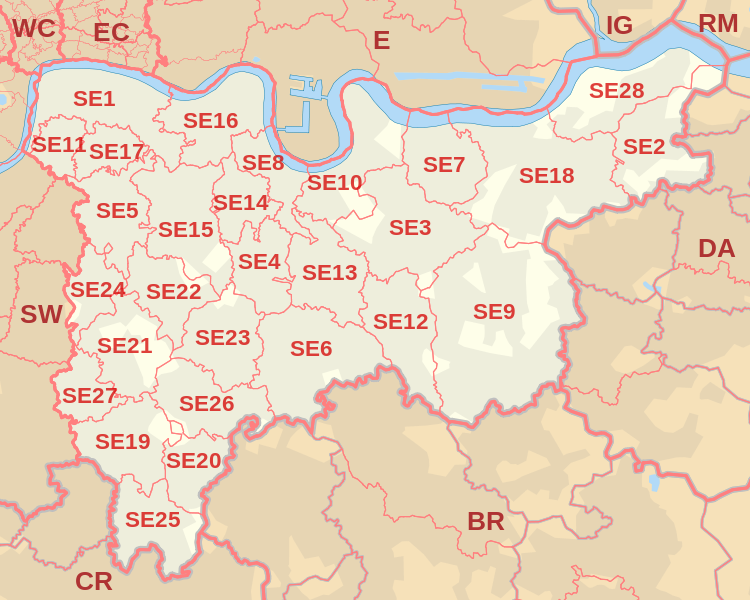
Southwark Property Market at Postcode level
 |
| Postcode |
Coverage Area
|
Local Authority Area |
| SE1 |
Bankside, South Bank, Lambeth (part), Southwark, Bermondsey (part), Vauxhall (part), Old Kent Road (part)
|
Lambeth, Southwark, City of London |
| SE4 |
Brockley, Crofton Park |
Lewisham, Southwark |
| SE5 |
Camberwell, Denmark Hill, Peckham, Brixton (part) |
Southwark, Lambeth |
| SE8 |
Deptford, Evelyn, Rotherhithe |
Greenwich, Lewisham, Southwark |
| SE11 |
Kennington, Lambeth (part), Vauxhall (part) |
Lambeth, Southwark |
| SE14 |
New Cross |
Lewisham, Southwark |
| SE15 |
Peckham, Nunhead, South Bermondsey (part), Old Kent Road (part) |
Lewisham, Southwark |
| SE16 |
Rotherhithe, Surrey Quays |
Southwark |
| SE17 |
Walworth, Kennington (part), Newington |
Southwark |
| SE19 |
Upper Norwood, Crystal Palace |
Bromley, Croydon, Lambeth, Lewisham, Southwark |
| SE21 |
Dulwich, Dulwich Village, West Dulwich, Tulse Hill (part) |
Lambeth, Southwark |
| SE22 |
East Dulwich, Dulwich Village (part), Peckham Rye, Loughborough Junction, Herne Hill |
Southwark |
| SE23 |
Forest Hill, Honor Oak, Crofton Park (part) |
Lewisham, Southwark |
| SE24 |
Herne Hill, Tulse Hill (part), Dulwich (part) |
Lambeth, Southwark |
| SE26 |
Sydenham, Crystal Palace (part) |
Bromley, Lewisham, Southwark |
For property market details at post code level please click on Postcode in the table above.
Month-wise Break-up of Total Sales
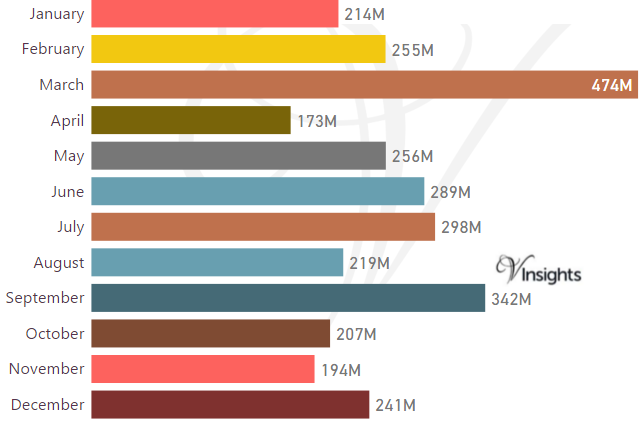
Some of the insights based on the £3.16 billions month-wise break-down :
Stamp Duty Hike Impact
- March had property sale spike of £474 millions compared to £255 millions in Feb
- The impetus for it was to avoid the extra 3% in Stamp Duty Tax applicable on buying an additional home, being applicable from April 1 2016
Brexit Impact
- Brexit took place on 23rd June 2016.
- As can be observed from the month-wise break-up there does not seem to have been some dip in property sales in the immediate aftermath of Brexit
- Year on Year the property market for Southwark has shown a growth of 8.96% over 2015
Total No Of Properties Sold By Property Type
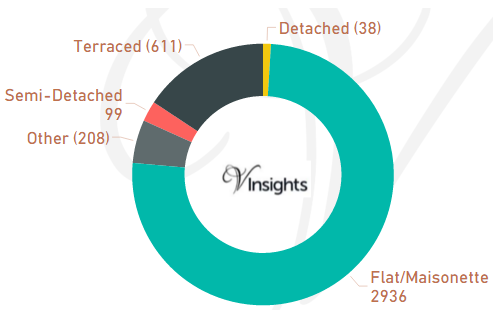
In Southwark the total number of properties sold in year 2016 was 3892. The breakdown by different property types are:
- Terraced 611 (15.7%)
- Semi-Detached 99 (2.54%)
- Other 208 (5.34%)
- Flat/Maisonette 2936 (75.44%)
- Detached 38 (0.98%)
Year on Year Comparison : Compared to Southwark Property Market 2015 in 2016
- Total sales volume has declined by 708 i.e. 15.4 %
- All the property type had lower sales volume compared to 2015 except Other
- Other has shown growth of 89% in number of sales
Average & Median Sales Price
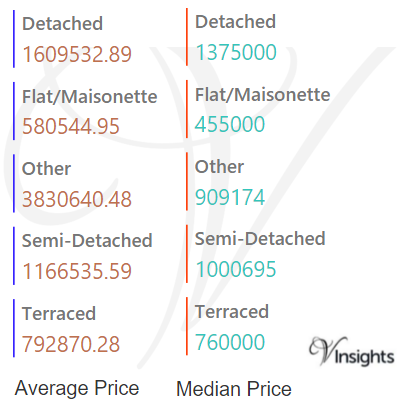
In 2015 the Average property price was £813 K in Southwark. The average price for the different property types are:
- Detached £1.61 millions
- Flat/Maisonette £581 K
- Other £3.83 millions
- Semi-Detached £1.17 million
- Terraced £793 K
The Median Price was £504 K. The median property price for the different property types are:
- Detached £1.38 millions
- Flat/Maisonette £455 K
- Other £909 K
- Semi-Detached £1 millions
- Terraced £760 K
Year on Year Comparison : Compared to Southwark Property Market 2015 in 2016
- Property types Detached , Other have had decrease in average and median property prices
- Flat, Semi-Detached, Terraced have had increase in average and median property price
New Vs Not New Property Statistics
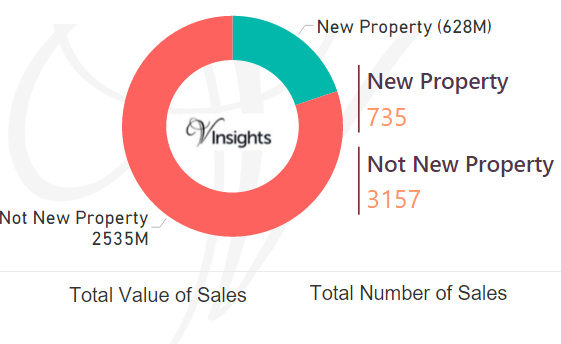
By Value Of Sales
- Not New Property contributed £2.54 billions (80.16%)
- New Property £628 millions (19.84%)
By Number Of Sales
- The number of Not New Property sold was 3157 (81.12%)
- The number of New Properties sold was 735 (18.88%)
Year on Year Comparison : Compared to Southwark Property Market 2015 in 2016
- New property market share in property market has gone up in 2016 over 2015
All London Posts
450f7d1a-64c1-48ab-859a-adaeed4d7bdd|0|.0|27604f05-86ad-47ef-9e05-950bb762570c