Story Highlights
- Woking had total property sales of £924 millions in 2016
- The total number of properties sold in 2016 was 1,863
- The average sales price was £496 K, whereas the median was £370 K
- New Property sales were 5.91% by value, whereas Not New Property contributed 94.09%
- Stamp duty changes caused monthly spike in March
- Brexit coupled with Stamp Duty changes did not have negative impact, there was growth of 3.3%
Woking is one of the districts of Surrey.
Total Sales By Property Type
Woking had total property sales of £924 millions which was 8.61% of the total Surrey Property Market 2016
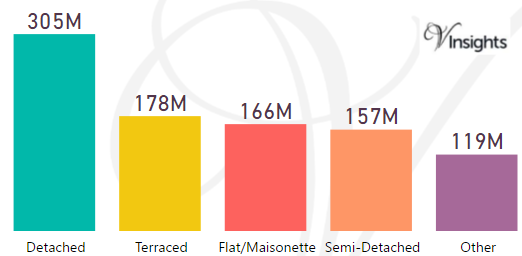
The split of £924 millions across the different property types are:
- Detached £305 millions (32.96%)
- Terraced £178 millions (19.26%)
- Flat/Maisonette £166 millions (17.93%)
- Semi-Detached £157 millions (17.01%)
- Other £119 millions (12.84%)
Woking Property Market at Postcode Level
| Postcode |
Coverage Area |
School |
Local Authority Area |
| GU21 |
Woking, Knaphill, St. John's, Horsell, Goldsworth Park |
Details |
Woking |
| GU22 |
Woking, Pyrford, Hook Heath, Mayford, Old Woking |
Details |
Woking |
| GU24 |
Bisley, Pirbright, Chobham, Knaphill, Brookwood, West End |
Details |
Woking, Surrey Heath, Guildford |
| KT14 |
Byfleet, West Byfleet |
Details |
Woking, Elmbridge, Runnymede |
| KT15 |
Addlestone, New Haw, Woodham |
Details |
Runnymede, Woking |
Month-wise Break-up of Total Sales
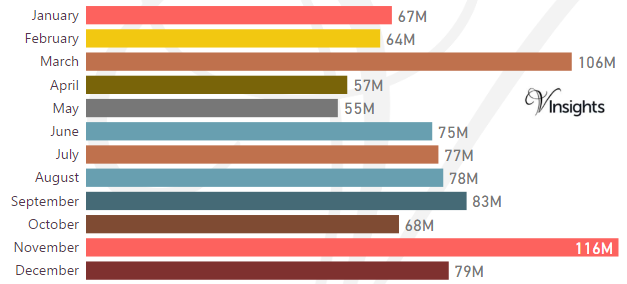
Some of the insights based on the £924 millions month-wise break-down :
Stamp Duty Hike Impact
- March had property sale spike of £106 millions compared to £64 millions in Feb and then sales sharply drop
- The impetus for it was to avoid the extra 3% in Stamp Duty Tax applicable on buying an additional home, being applicable from April 1 2016
Brexit Impact
- Brexit took place on 23rd June 2016.
- Year on Year growth has been 3.3% in 2016 over 2015
- Brexit coupled with Stamp Duty Hike had no negative impact on Woking Property Market in 2016
Total No Of Properties Sold By Property Type
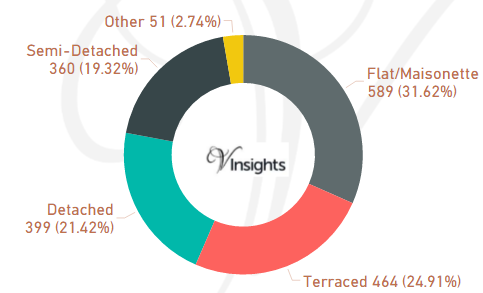
Woking had total property sales of 1,863. The split across the different property types are:
- Flat/Maisonette 589 (31.62%)
- Terraced 464 (24.91%)
- Detached 399 (21.42%)
- Semi-Detached 360 (19.32%)
- Other 51 (2.74%)
Average & Median Sales Price
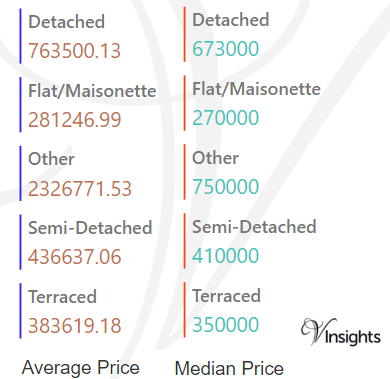
The average sales price in Woking was £496 K and for different property types it was:
- Detached £764 K
- Semi-Detached £437 K
- Terraced £384 K
- Flat/Maisonette £281 K
- Other it is £ 2.3 millions
Similarly median sales price in Woking was £370 K and for different property types are:
- Detached £673 K
- Semi-Detached £410 K
- Terraced £350 K
- Flat/Maisonette £270 K
- Other it is £750 K
New Vs Not New Property Statistics
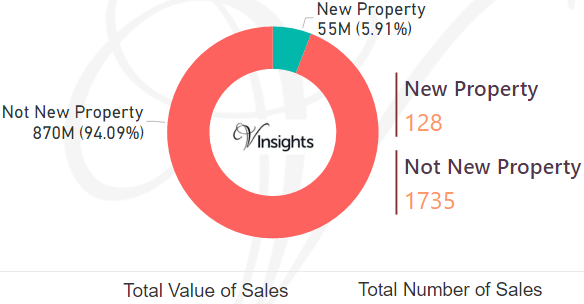
By Sales Value the split is as follows:
- New Property contributed £55 millions (5.91%)
- Not New Property contributed £870 millions (94.09%)
By Total Number the split is as follows:
- New properties sold were 128 (6.87%)
- Not new property sold were 1,735 (93.13%)
All Surrey Posts

a8a34d06-924c-4c37-af69-a4749cce33b1|0|.0|27604f05-86ad-47ef-9e05-950bb762570c