
Story Highlights
- Wales had total property sales of £8.67 Billions in 2016
- Total Sales By Principal Area was maximum in Cardiff at £1.5 Billions
- The total number of properties sold in 2016 was 47,959 properties
- The average sales price in Wales was £181 K, whereas median was £145 K
- The average sales price in Wales at Principal Area level was max for Monmouthshire £276 K
- New Property sales were 7.28% by value, whereas Not New Property contributed 92.72%
- Stamp duty hike caused monthly spike in March
- Brexit coupled with Stamp Duty Hike did not have negative impact on Wales property Market 2016.
Total Sales By County
Wales had total property sales of £8.67 Billions. It contributed 2.92% of the England and Wales Property Market 2016.
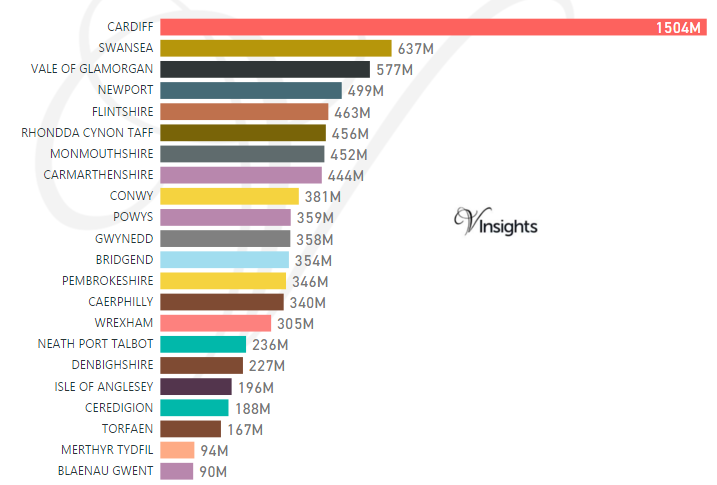
The split of £8.67 Billions across its principal areas is as below :
- Cardiff £1.5 Billion (17.35%)
- Swansea £637 millions (7.34%)
- Vale Of Glamorgan £577 millions (6.65%)
- NewPort £499 millions (5.76%)
- Flintshire £463 millions (5.33%)
- Rhondda Cynon Taff £456 millions (5.25%)
- Monmouthshire £452 millions (5.21%)
- Carmarthenshire £444 millions (5.13%)
- Conwy £381 millions (4.4%)
- Powys £359 millions (4.14%)
- Gwynedd £358 millions (4.13%)
- Bridgend £354 millions (4.08%)
- Pembrokeshire £346 millions (3.99%)
- Caerphilly £340 millions (3.92%)
- Wrexham £305 millions (3.52%)
- Neath Port Talbot £236 millions (2.72%)
- Denbighshire £227 millions (2.62%)
- Isle Of Anglesey £196 millions (2.26%)
- Ceredigion £188 millions (2.16%)
- Torfaen £167 millions (1.92%)
- Merthyr Tydfil £94 millions (1.08%)
- Blaenau Gwent £90 millions (1.04%)
Year on Year Comparison : Compared to Wales Property Market All Principal Areas 2015 in 2016
Total Value of Sales By Property Types
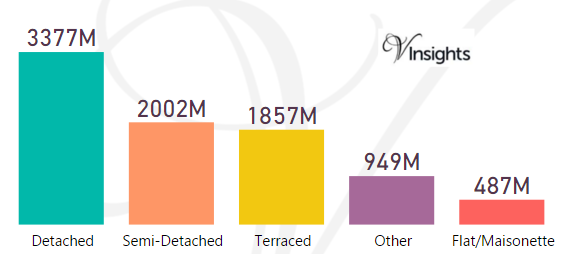
The total sales value of £8.67 billion split by property types in Wales 2016 was:
- Detached £3.38 billions (38.94%)
- Semi-Detached £2 billions (23.08%)
- Terraced £1.86 billions (21.42%)
- Other £949 millions (10.94%)
- Flat/Maisonette £487 millions (5.62%)
Year on Year Comparison : Compared to Wales Property Market 2015 in 2016
- All the property types sales have shown growth over 2015
Month-wise Break-up of Total Sales
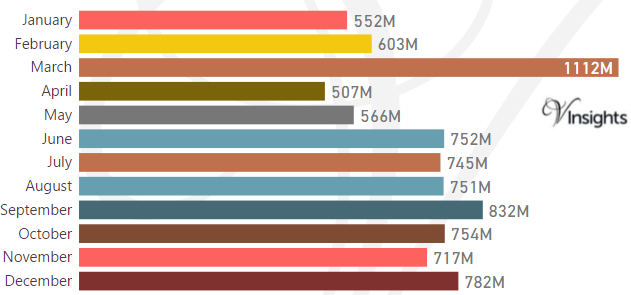
Some of the insights based on the £8.67 billion month-wise break-down :
Stamp Duty Hike Impact
- March had property sale spike of £1.11 billions compared to £603 millions in Feb
- The impetus for it was to avoid the extra 3% in Stamp Duty Tax applicable on buying an additional home, being applicable from April 1 2016
Brexit Impact
- Brexit took place on 23rd June 2016.
- As can be observed from the month-wise break-up there does not seem to have been dip in property sales in the immediate aftermath of Brexit
- Year on Year growth has been 3.58% so there was no negative Brexit Impact
Total Number of Sales By Property Types
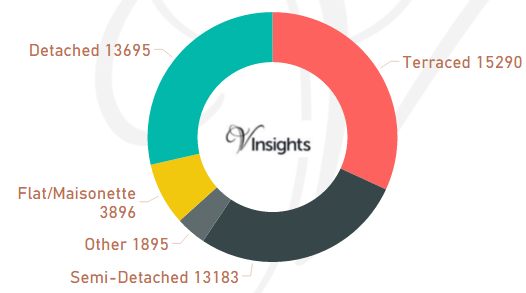
The total number of property transactions in Wales 2016 was 47,959
- Terraced 15,290 (31.88%)
- Detached 13,695 (28.56%)
- Semi-Detached 13,183 (27.49%)
- Flat/Maisonette 3,896 (8.12%)
- Other 1,895 (3.95%)
Year on Year Comparison : Compared to Wales Property Market 2015 in 2016
- All property types had growth in number of properties sold
- Other had significant growth of 139%
Average & Median Sales Price
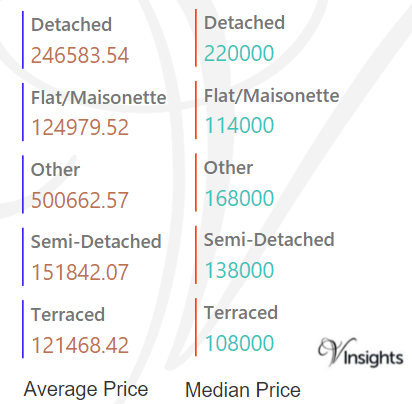
The average sales price in Wales was £181 K. For the different property types it was:
- Detached at £247 K
- Semi-Detached at £152 K
- Terraced at £122 K
- Flat/Maisonette at £125 K
- Other it is at £501 K
The median sales price in Wales was £145 K. For the different property types it was:
- Detached at £220 K
- Semi-Detached at £138 K
- Terraced at £108 K
- Flat/Maisonette at £114 K
- Other it is at £168 K
Year on Year Comparison : Compared to Wales Property Market 2015 in 2016
- All property type had increase in average and median sales price except Other
Average & Median Sales Price By County
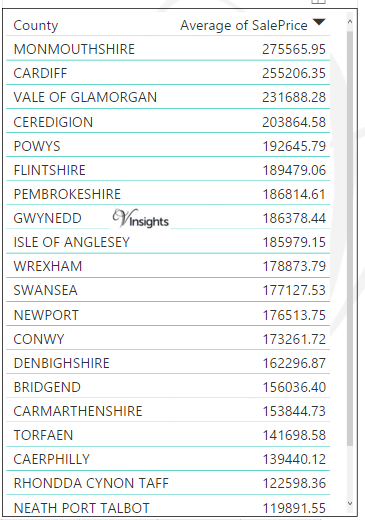
The average sales price by county in Wales by Principal Areas in 2016 was:
- Monmouthshire £276 K
- Cardiff £255 K
- Vale Of Glamorgan £232 K
- Ceredigion £204 K
- Powys £193 K
- Flintshire £190 K
- Pembrokeshire £187 K
- Gwynedd £186 K
- Isle Of Anglesey £186 K
- Wrexham £179 K
- Swansea £177 K
- NewPort £177 K
- Conwy £173 K
- Denbighshire £162 K
- Bridgend £156 K
- Carmarthenshire £154 K
- Torafen £142 K
- Caerphilly £139 K
- Rhondda Cynon Taff £123 K
- Neath Port Talbot £120 K
- Merthyr Tydfil £112 K
- Blaenau Gwent £105 K
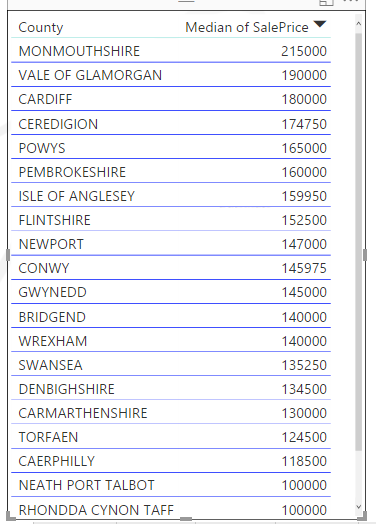
The median sales price by county in Wales by Principal Areas in 2016 was:
- Monmouthshire £215 K
- Vale Of Glamorgan £190 K
- Cardiff £180 K
- Ceredigion £175 K
- Powys £165 K
- Pembrokeshire £160 K
- Isle Of Anglesey £160 K
- Flintshire £153 K
- NewPort £147 K
- Conwy £146 K
- Gwynedd £145 K
- Bridgend £140 K
- Wrexham £140 K
- Swansea £135 K
- Denbighshire £135 K
- Carmarthenshire £130 K
- Torafen £125 K
- Caerphilly £119 K
- Neath Port Talbot £100 K
- Rhondda Cynon Taff £100 K
- Merthyr Tydfil £85 K
- Blaenau Gwent £79 K
Year on Year Comparison : Compared to Wales Property Market All Principal Areas 2015 in 2016
- Average Sales Price has gone up except for Vale Of Glamorgan, Pembrokeshire, Swansea,Neath Port Talbot,Merthyr Tydfil
- Median Sales price has gone up except for Pembrokeshire, Neath Port Talbot, Rhondda Cynon Taff, Merthyr Tydfil
New Vs Not New Property Statistics
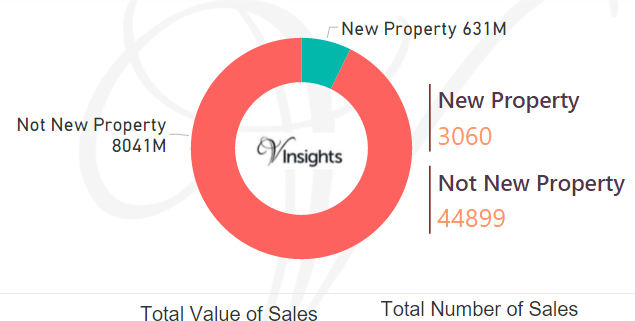
By Sales Value
- Sales value contributed by New Property was £631 millions (7.28%)
- Not New Property contributed £8.04 billions (92.72%).
By Number Of Sales
- New Properties sold were 3,060 (6.38%)
- Not New Properties sold were 44,899 (93.62%)
Year on Year Comparison : Compared to Wales Property Market 2015
- New property market share in property market has gone down in 2016 over 2015
All Wales Post

9957a7f9-04c6-433a-9e8b-44ef8342f308|0|.0|27604f05-86ad-47ef-9e05-950bb762570c
12. October 2016 07:48
/
VInsights Team
/
Wales
/
Comments (0)
Wales comprises of 22 principal areas for the purpose of local government. It comprises of: BlaenauGwent,Bridgend,Caerphilly,Cardiff,Carmarthenshire,Ceredigion,Conwy,Denbighshire, Flintshire, Gwynedd,Isle of Anglesey,Merthyr Tydfil,Monmouthshire,Neath Port Talbot,Newport,Pembrokeshire,Powys,Rhondda Cynon Taf,Swansea,Torfaen,Vale of Glamorgan,Wrexham.
Total Value of Sales By Principal Areas
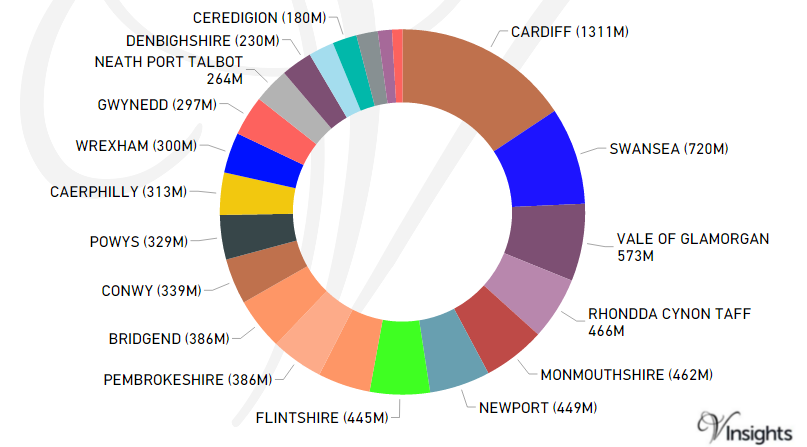
The total sales of £8.37 billion split by Counties/Principal Area in 2015 was :
- Cardiff £1.3 Billion (15,67%)
- Swansea £720 millions (8.61%)
- Vale Of Glamorgan £573 millions (6.85 %)
- Rhondda Cynon Taff £466 millions (5,57 %)
- Monmouthshire £462 millions (5.52%)
- NewPort £449 millions (5.36%)
- Flintshire £445 millions (5.32%)
- Carmarthenshire £388 millions (4.64%)
- Pembrokeshire £386 millions (4.62%)
- Bridgend £386 millions (4.61%)
- Conwy £339 millions (4.05%)
- Powys £329 millions (3.94%)
- Caerphilly £313 millions (3.74 %)
- Wrexham £300 millions (3.59%)
- Gwynedd £297 millions (3,55%)
- Neath Port Talbot £264 millions (3.15%)
- Denbighshire £230 millions (2.75%)
- Isle Of Anglesey £189 millions (2.26%)
- Ceredigion £180 millions (2.15%)
- Torfaen £159 millions (1.9%)
- Merthyr Tydfil £105 millions (1,25%)
- Blaenau Gwent £77 millions (0.92%)
Total Number Of Properties Sold By Principal Areas
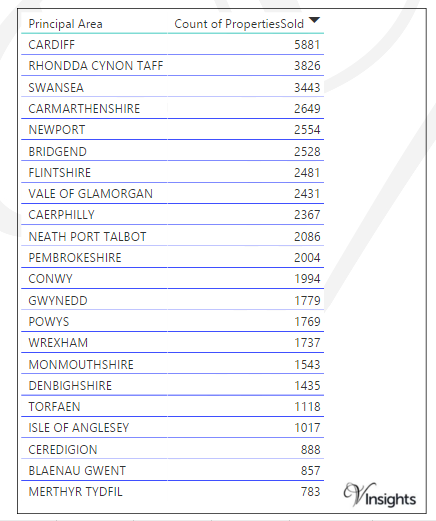
The Total number of properties sold by Principal Areas in 2015 are
Principal Areas Average & Median Sales Price
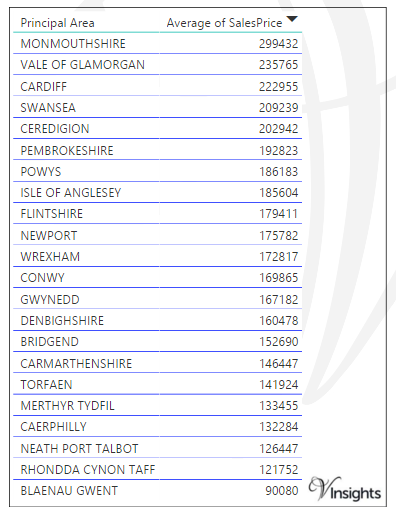
The average price of properties sold by Principal Areas in 2015 are
- Monmouthshire £229 K
- Vale Of Glamorgan £236 K
- Cardiff £223 K
- Swansea £209 K
- Ceredigion £203 K
- Pembrokeshire £193 K
- Powys £186 K
- Isle Of Anglesey £186 K
- Flintshire £179 K
- NewPort £176 K
- Wrexham £173 K
- Conwy £170 K
- Gwynedd £167 K
- Denbighshire £161 K
- Bridgend £153 K
- Carmarthenshire £147 K
- Torafen £142 K
- Merthyr Tydfil £134 K
- Caerphilly £132 K
- Neath Port Talbot £127 K
- Rhondda Cynon Taff £122 K
- Blaenau Gwent £90 K
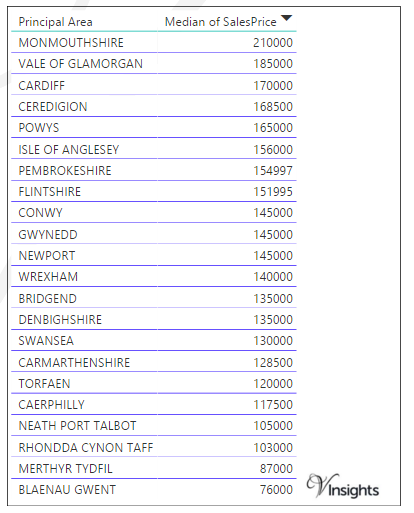
The median price of properties sold by Principal Areas in 2015 are
- Monmouthshire £210 K
- Vale Of Glamorgan £185 K
- Cardiff £170 K
- Ceredigion £169 K
- Powys £165 K
- Isle Of Anglesey £156 K
- Pembrokeshire £155 K
- Flintshire £152 K
- Conwy £145 K
- Gwynedd £145 K
- NewPort £145 K
- Wrexham £140 K
- Bridgend £135 K
- Denbighshire £135 K
- Swansea £130 K
- Carmarthenshire £129 K
- Torafen £120 K
- Caerphilly £118 K
- Neath Port Talbot £105 K
- Rhondda Cynon Taff £103 K
- Merthyr Tydfil £87 K
- Blaenau Gwent £76 K
All Wales Post
ceecbb9e-3875-430a-b1d4-1fc0cc64e65d|0|.0|27604f05-86ad-47ef-9e05-950bb762570c
29. September 2016 21:31
/
VInsights Team
/
Wales
/
Comments (0)
For 2016 details - Wales Property Market 2016
Story Highlights
- Wales had total property sales of £8.37 billion in 2015 spread over 47,710 properties.
- It was £58.35 million increase over 2014, which is 7.5% growth.
- In 2015 average property price in Wales was £177 k and median price of £140 k
- The average property price went up by £7 k and median by £4 k over 2014
- New property sales in 2015 was £877 millions (10.47%) & Not New Property Sales Value was £7493 millions (89.53%)
Total Value of Sales By Property Types
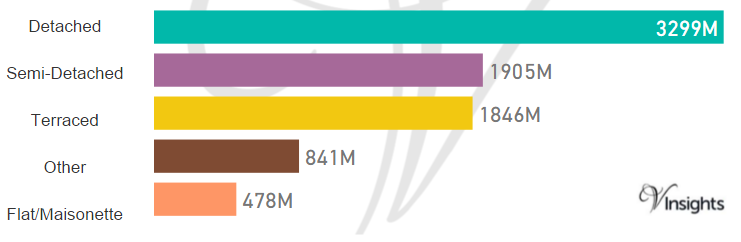 The total sales value of £8.37 billion by property types in Wales 2015 are:
- Detached £3.29 billions (39.41%)
- Semi- Detached £1.9 billions (22.76%)
- Terraced £1.85 billions (22.05%)
- Flat/Maisonette £478 millions (5.72%)
- Other £841 millions (10.05%)
Total Number of Sales By Property Types
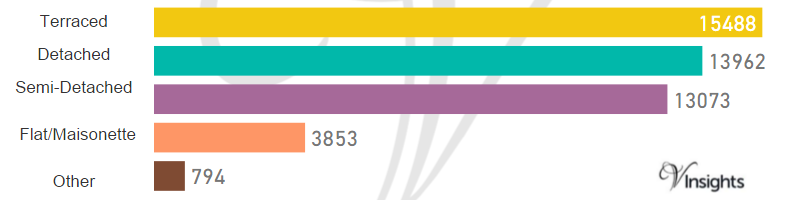 The total number of property transactions in Wales 2015 was 47,170.
- Terraced 15,488 (32.83%)
- Detached 13,962 (29.62%)
- Semi-Detached 13,073 (27.71%)
- Flat/Maisonette 3,853 (8.17%)
- Other 794 (1.68%)
Average & Median Sales Price
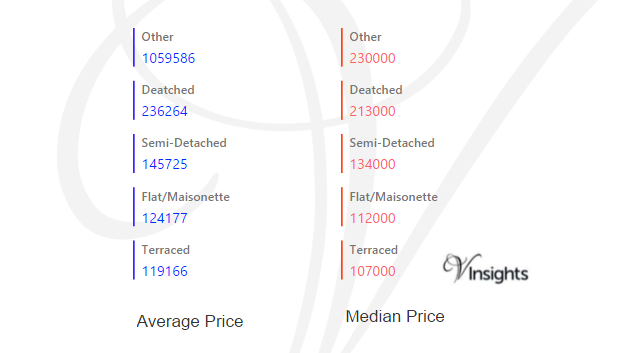
The average sales price by property types in Wales 2015 are:
- Other £1.06 million
- Detached £236 k
- Semi-Detached £146 k
- Flat/Maisonette £124 k
- Terraced £119 k
The median sales price by property types are:
- Other £ 230 k
- Detached £213 k
- Semi-Detached £134 k
- Flat/Maisonette £112 k
- Terraced £107 k
New Vs Not New Property Statistics
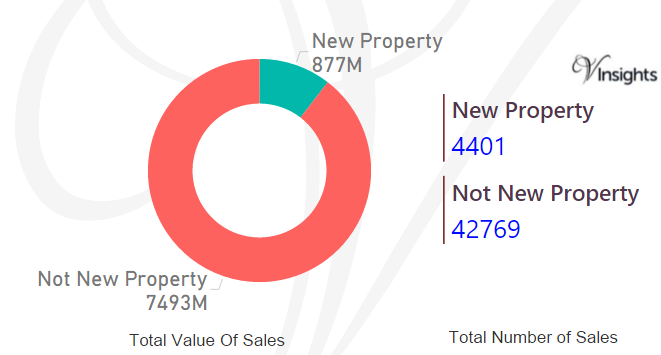
Out of Total Sales of £8.37 billions in Wales 2015
- New Property Sales Values was £877 millions (10.47%)
- Not New Property Sales Value was £7493 millions (89.53%)
Similarly Total Number Of Property Sales in Wales was 47,170
- New Property Sales was 4401 (9.33%)
- Number of Not New Property Sales was 42769 (90.67%).
We will further drill down by region, county in later posts to gain further insights !
All Wales Post 
f2cdf312-5a47-4192-9c76-5a3f4f3b5139|0|.0|27604f05-86ad-47ef-9e05-950bb762570c