Story Highlights
- Ashford had total property sales of £772 millions in 2016
- The total number of properties sold in 2016 was 2,636
- The average sales price was £293 K, whereas the median was £240 K
- New Property sales were 17.43% by value, whereas Not New Property contributed 82.57%
- Stamp duty changes caused monthly spike in March
- Brexit coupled with Stamp Duty changes did not have negative impact, there was robust growth of 10%
Ashford is one of the districts of Kent
Total Sales By Property Type
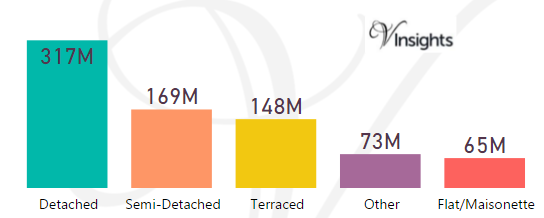
Ashford had total property sales of £772 millions which was 8.28% of the total Kent Property Market 2016
The split £772 millions across the different property types are:
- Detached £317 millions (41.04%)
- Semi-Detached £169 millions (21.87%)
- Terraced £148 millions (19.19%)
- Other £73 millions (9.5%)
- Flat/Maisonette £65 millions (8.4%)
Ashford Property Market at Postcode Level
| Postcode |
Coverage Area |
School |
Local Authority Area |
| CT4 |
Chartham,Bridge |
Details |
Canterbury, Ashford |
| TN17 |
Cranbrook,Goudhurst,Benenden,Frittenden |
Details |
Ashford, Tunbridge Wells |
| TN23 |
Ashford(town centre),Kingsnorth,Singleton |
Details |
Ashford |
| TN24 |
Willesborough,Kennington,Boughton Aluph, Goat Lees |
Details |
Ashford |
| TN25 |
Challock,Wye,Stowting,Brook |
Details |
Ashford,Shepway |
| TN26 |
Bethersden,Hamstreet,Shadoxhurst,Woodchurch |
Details |
Ashford |
| TN27 |
Headcorn,Biddenden |
Details |
Ashford, Maidstone |
| TN30 |
Tenterden,Wittersham |
Details |
Ashford |
Month-wise Break-up of Total Sales
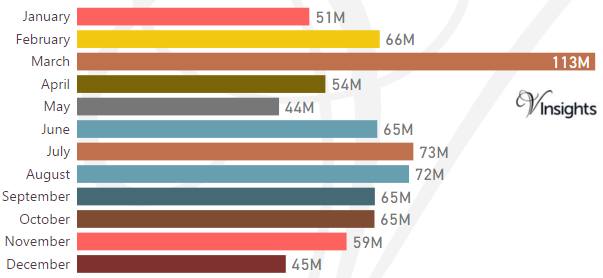
Some of the insights based on the £772 millions month-wise break-down :
Stamp Duty Hike Impact
- March had property sale spike of £113 millions compared to £66 millions in Feb
- The impetus for it was to avoid the extra 3% in Stamp Duty Tax applicable on buying an additional home, being applicable from April 1 2016
Brexit Impact
- Brexit took place on 23rd June 2016.
- Year on Year growth has been 10% in 2016 over 2015
- Brexit coupled with Stamp Duty Hike did not have negative impact and there was robust growth
Total No Of Properties Sold By Property Type
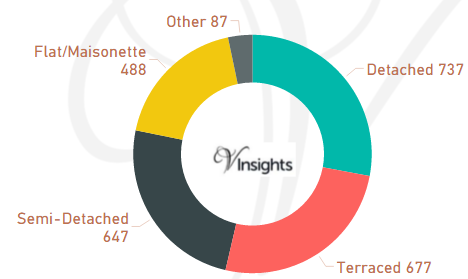
Ashford had total property sales of 2636. The split across the different property types are:
- Detached 737 (27.96%)
- Terraced 677 (25.68%)
- Semi-Detached 647 (24.54%)
- Flat/Maisonette 488 (18.51%)
- Other 87 (3.3%)
Average & Median Sales Price
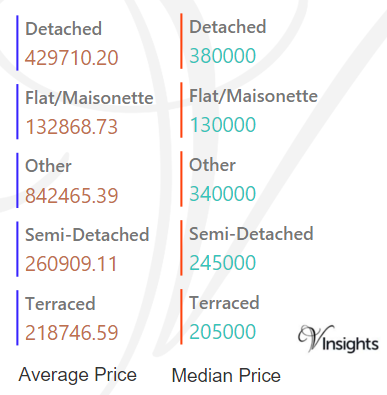
The average sales price in Ashford was £293 K and for different property types it was:
- Detached £430 K
- Semi-Detached £261 K
- Terraced £219 K
- Flat/Maisonette £133 K
- Other it is £842 K
Similarly median sales price in Ashford was £240 K and for different property types are:
- Detached £380 K
- Semi-Detached £245 K
- Terraced £205 K
- Flat/Maisonette £130 K
- Other it is £340 K
New Vs Not New Property Statistics
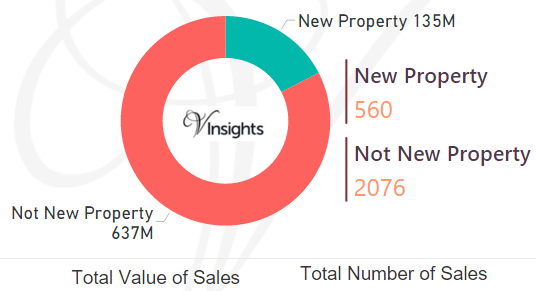
By Sales Value the split is as follows:
- New Property contributed £135 millions (17.43%)
- Not New Property contributed £637 millions (82.57%)
By Total Number the split is as follows:
- New properties sold were 560 (21.24%)
- Not new property sold were 2,076 (78.76%)
All Kent Posts

8a7d89ea-471c-4b8a-bf53-ddcd4b7d7d9c|0|.0|27604f05-86ad-47ef-9e05-950bb762570c