Story Highlights
- London had total property sales of approx. £76 billions in 2016
- The maximum sales was in Central London at £25 billions
- The total number of London properties sold in 2016 was 112,790
- The average sales price in London was £673.82 K, whereas median was £435 K
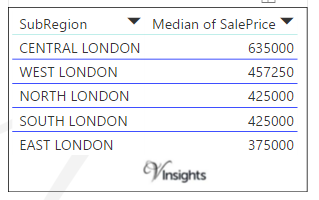
- By region the average price was maximum in Central London at £1.29 millions and median at £635 K
- New Property sales were 11.93% by value, where as Not New Property contributed 88.07%
- Stamp duty changes caused monthly spike in March
- Brexit coupled with Stamp Duty changes caused decline in London property market 2016
London or Greater London is the capital and most populous city of England and United Kingdom. It is a region in England and organized into 33 administrative units: the 32 London Boroughs and the City of London.
The 33 boroughs are broadly divided into 5 regions : Central London, East London , North London , South London, West London
- Central London comprises of Camden, City Of London, Westminster, Islington, Kensington & Chelsea, Lambeth, Southwark
- East London comprises of Barking and Dagenham, Lewisham, Newham, Redbridge, Tower Hamlets, Waltham Forest, Bexley, Greenwich , Hackney, Havering
- North London comprises of Barnet , Enfield, Haringey.
- South London comprises of Bromley, Croydon, Kingston Upon Thames, Merton, Sutton, Wandsworth
- West London comprises of Brent, Ealing, Hammersmith & Fulham, Harrow, Hillingdon, Hounslow, Richmond upon Thames
Total Sales By London Region
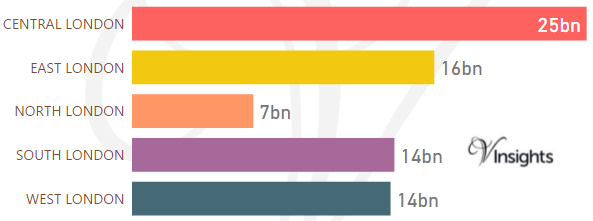
The total property sales in London was approx. £76 billions. It was 25.57% of the England and Wales Property Market 2016.
Region wise Split of London property market 2016 was :
Year on Year Comparison : Compared to London Property Market 2015 in 2016
Total Value of Sales By Property Types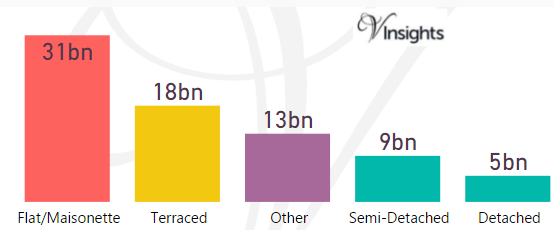
The split of £76 billions across the different property types are:
- Flat/Maisonette £31.4 billions (41.32%)
- Terraced £18.14 billions (23.86%)
- Other £12.86 billions (16.91%)
- Semi-Detached £8.68 billions (11.42%)
- Detached £4.92 billions (6.47%).
Year on Year Comparison : Compared to London Property Market 2015 in 2016
- All the property types have shown decline in sales value except others.
- Other sales value has remained constant.
Month-wise Break-up of Total Sales
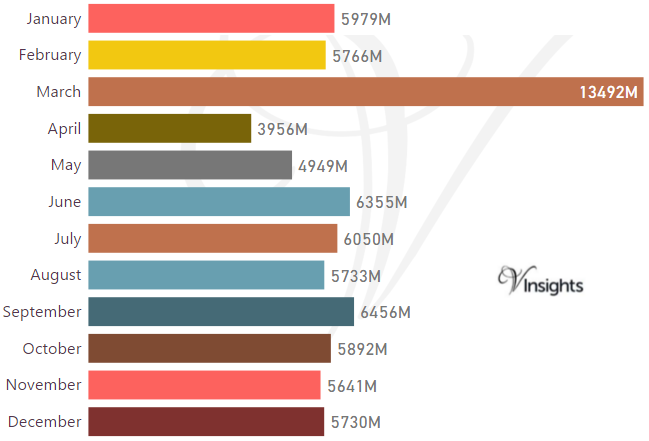
Some of the insights based on the £76 billions month-wise break-down :
Stamp Duty Hike Impact
- March had property sale spike of £ 13.49 billions compared to £ 5.8 billions in Feb
- The impetus for it was to avoid the extra 3% in Stamp Duty Tax applicable on buying an additional home, being applicable from April 1 2016
Brexit Impact
- Brexit took place on 23rd June 2016.
- As can be observed from the month-wise break-up there does not seem to have been significant dip in property sales in the immediate aftermath of Brexit
- Year on Year the property market for London has shown a decline of 7.32% over 2015
Total Number Of Sales By Property Types
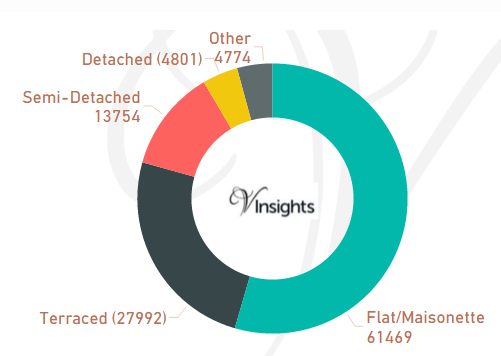
The total number of properties sold in London in 2015 was 112,790. It is split as:
- Flat/Maisonette 61469 (54.5%)
- Terraced 27992 (24.82%)
- Semi-Detached 13754 (12.19%)
- Detached 4801 (4.26%)
- Other 4774 (4.23%)
Year on Year Comparison : Compared to London Property Market 2015 in 2016
- Total number of property sales in London has decreased by 15,416 which is 12.2% decline
- All property types have shown decline in number of properties sold except property type Other
- Other has shown significant increase of 58% from 3012 in 2015 to 4774 in 2016.
Average & Median Sales Price
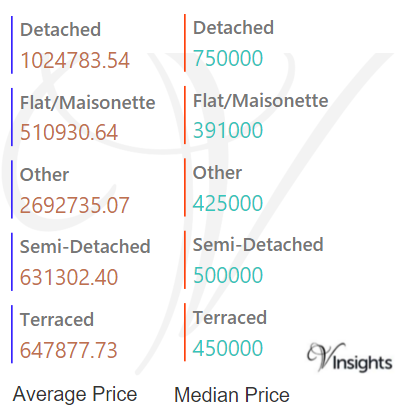
The average sales price in London was £673.82 K. For the different property types it was:
- Detached £1.025 millions
- Semi-Detached £631 K
- Terraced £648 K
- Flat/Maisonette £511 K
- For Other it is £2.7 millions
Similarly the median sales price in London was £435 K. For the different property types it was:
- Detached £750 K
- Semi-Detached £500 K
- Terraced £450 K
- Flat/Maisonette £391 K
- For Other it is £425 K.
Year on Year Comparison : Compared to London Property Market 2015
- The average and median sales price across all property types have gone up except for others
- Other property type has shown a decline in average and median sales price.
- So coupled with the fact that Other total sales value has remained constant, it indicates that property for business and commercial property has become cheaper.
Average & Median Sales Price By London Region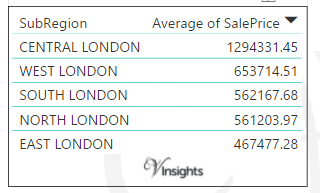
The Average Sales Price By London Regions was
Year on Year Comparison : Compared to London Property Market 2015 in 2016
- The average and median sales price across all the London regions have gone up with Central London leading the pack.
New Vs Not New Property Statistics
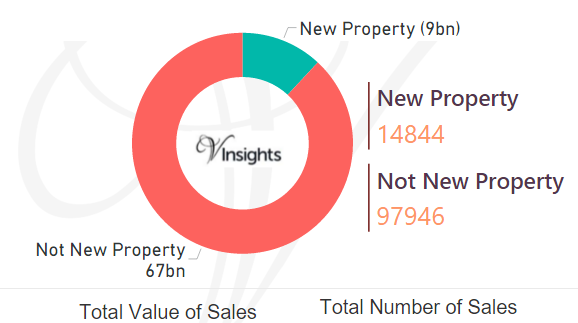
By Value Of Sales
- The sales value contributed by New Property was £9 billions (11.93%)
- Not New Property contributed £67 billions (88.07%).
By Number Of Sales
- New properties sold were 14844 (13.16%)
- where as not new property sold were 97946 (86.84%).
Year on Year Comparison : Compared to London Property Market 2015 in 2016
- New property market share in London property market 2016 has gone up in 2016 over 2015
All London Posts
69afa6c7-798b-42f9-80c6-963c51c2caa7|0|.0|27604f05-86ad-47ef-9e05-950bb762570c